OPEN-SOURCE SCRIPT
Time Price Opportunity Gravity Grid [ALT_analyst]
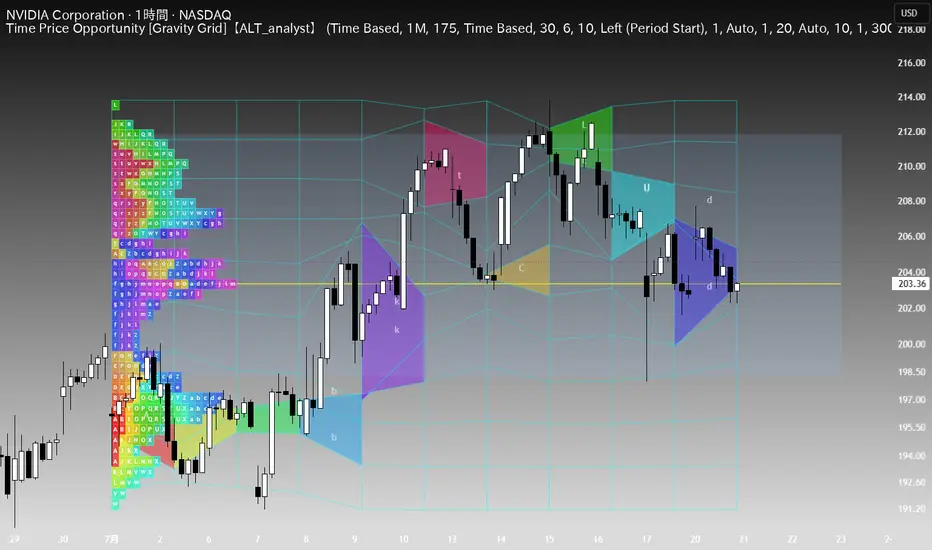
Time Price Opportunity Gravity Grid [ALT_analyst]
■ Description
This script executes a strictly quantified market structure analysis by integrating Time Price Opportunity (TPO) profiling, dynamic Value Area (70%) boundaries, POC Migration matrices, and Z-Score volatility anomaly detection.
By overriding standard OHLC data limitations via lower-timeframe data injection (request.security_lower_tf), it constructs an uncompromisingly high-resolution price-density profile. Trend definitions and signal thresholds are stripped of subjective bias, executing purely on the spatial shift of accepted value and mathematical volatility expansion.
■ Core Architecture & Mechanical Edge
The algorithm mandates the simultaneous confluence of three independent mathematical variables. This relentless confluence acts as a strict mechanical filter, systematically rejecting ranging environments and isolating only mathematically significant structural shifts.
1. Value Area Calculation (70% Auction Density)
Mechanics:
Computes the absolute TPO block count per session, isolating the exact price range containing 70% of execution density (approximating 1 standard deviation).
Expansion originates strictly from the POC (maximum density node) and iteratively absorbs adjacent price rows based on relative volume weight, capturing the absolute center of the market auction.
Visualization:
Deployed as modern, semi-transparent filled boxes (Value Area Box) to eliminate visual noise, obsoleting legacy dashed-line renderings.
Application:
Price action within the Value Area is mathematically defined as balance.
A confirmed close outside this boundary signals structural imbalance. To mathematically neutralize low-volume fakeouts, breakouts are strictly invalidated unless simultaneously confirmed by both POC Migration and Volatility expansion.
2. POC Migration (Structural Trend)
Mechanics:
Evaluates the spatial shift of accepted value across consecutive sessions using a discrete step-function.
Pine Script®
Application:
By demanding the simultaneous directional shift of both the peak density (POC) and the boundary floor/ceiling (VAL/VAH), the script verifies that the core market consensus has definitively relocated.
3. Volatility Z-Score (Anomaly Detection)
Mechanics & Equation:
Pine Script®
Calculation Rationale:
To measure exactly how many standard deviations the current volatility deviates from its 100-period baseline, standardizing volatility spikes across all asset classes regardless of absolute price.
Expected Output Example:
If current ATR is 1.5, 100-period mean is 1.0, and standard deviation is 0.2, the Z-Score outputs 2.5 (+2.5 standard deviations above the mean).
Application:
A Z-Score strictly > 2.0 flags a statistical outlier (top ~2.2% of historical occurrences). The algorithm enforces this threshold to ensure breakouts are driven by aggressive, statistically significant kinetic expansion, rejecting market noise.
4. Gaussian Liquidity Grid Distortion
Mechanics & Equation:
Pine Script®
Calculation Rationale:
Utilizes a Gaussian decay function to translate historical price congestion into a gravitational pull on the background grid, mathematically quantifying market memory.
Expected Output Example:
If price is 100 ticks away with a radius of 200, the function outputs a multiplier of ~0.882, pulling the visual grid line 88.2% closer to the price center.
Application:
Distorted grid zones visually map historical liquidity pools (high probability of deceleration/mean reversion). Smooth grids indicate liquidity vacuums for rapid price discovery.
■ Signal Execution Rules
Signals execute ONLY upon total alignment:
Long Entry: Close strictly > active POC, Structural Trend = +1, Z-Score > 2.0.
Short Entry: Close strictly < active POC, Structural Trend = -1, Z-Score > 2.0.
Risk Management: Invalidations must mathematically reside outside the active Value Area (below VAL for longs, above VAH for shorts).
Disclaimer
This script provides objective mathematical analysis for educational purposes. It does not constitute financial advice.
■ Description
This script executes a strictly quantified market structure analysis by integrating Time Price Opportunity (TPO) profiling, dynamic Value Area (70%) boundaries, POC Migration matrices, and Z-Score volatility anomaly detection.
By overriding standard OHLC data limitations via lower-timeframe data injection (request.security_lower_tf), it constructs an uncompromisingly high-resolution price-density profile. Trend definitions and signal thresholds are stripped of subjective bias, executing purely on the spatial shift of accepted value and mathematical volatility expansion.
■ Core Architecture & Mechanical Edge
The algorithm mandates the simultaneous confluence of three independent mathematical variables. This relentless confluence acts as a strict mechanical filter, systematically rejecting ranging environments and isolating only mathematically significant structural shifts.
1. Value Area Calculation (70% Auction Density)
Mechanics:
Computes the absolute TPO block count per session, isolating the exact price range containing 70% of execution density (approximating 1 standard deviation).
Expansion originates strictly from the POC (maximum density node) and iteratively absorbs adjacent price rows based on relative volume weight, capturing the absolute center of the market auction.
Visualization:
Deployed as modern, semi-transparent filled boxes (Value Area Box) to eliminate visual noise, obsoleting legacy dashed-line renderings.
Application:
Price action within the Value Area is mathematically defined as balance.
A confirmed close outside this boundary signals structural imbalance. To mathematically neutralize low-volume fakeouts, breakouts are strictly invalidated unless simultaneously confirmed by both POC Migration and Volatility expansion.
2. POC Migration (Structural Trend)
Mechanics:
Evaluates the spatial shift of accepted value across consecutive sessions using a discrete step-function.
// Bullish Migration (+1):
Current_POC > Previous_POC and Current_VAL > Previous_VAL
// Bearish Migration (-1):
Current_POC < Previous_POC and Current_VAH < Previous_VAH
Application:
By demanding the simultaneous directional shift of both the peak density (POC) and the boundary floor/ceiling (VAL/VAH), the script verifies that the core market consensus has definitively relocated.
3. Volatility Z-Score (Anomaly Detection)
Mechanics & Equation:
Z_Score = (ATR(14) - SMA(ATR(14), 100)) / StDev(ATR(14), 100)
Calculation Rationale:
To measure exactly how many standard deviations the current volatility deviates from its 100-period baseline, standardizing volatility spikes across all asset classes regardless of absolute price.
Expected Output Example:
If current ATR is 1.5, 100-period mean is 1.0, and standard deviation is 0.2, the Z-Score outputs 2.5 (+2.5 standard deviations above the mean).
Application:
A Z-Score strictly > 2.0 flags a statistical outlier (top ~2.2% of historical occurrences). The algorithm enforces this threshold to ensure breakouts are driven by aggressive, statistically significant kinetic expansion, rejecting market noise.
4. Gaussian Liquidity Grid Distortion
Mechanics & Equation:
Pull_Factor = Math.exp(-(Distance_Y^2) / (2 * Pull_Radius^2))
Calculation Rationale:
Utilizes a Gaussian decay function to translate historical price congestion into a gravitational pull on the background grid, mathematically quantifying market memory.
Expected Output Example:
If price is 100 ticks away with a radius of 200, the function outputs a multiplier of ~0.882, pulling the visual grid line 88.2% closer to the price center.
Application:
Distorted grid zones visually map historical liquidity pools (high probability of deceleration/mean reversion). Smooth grids indicate liquidity vacuums for rapid price discovery.
■ Signal Execution Rules
Signals execute ONLY upon total alignment:
Long Entry: Close strictly > active POC, Structural Trend = +1, Z-Score > 2.0.
Short Entry: Close strictly < active POC, Structural Trend = -1, Z-Score > 2.0.
Risk Management: Invalidations must mathematically reside outside the active Value Area (below VAL for longs, above VAH for shorts).
Disclaimer
This script provides objective mathematical analysis for educational purposes. It does not constitute financial advice.
Скрипт с открытым кодом
В истинном духе TradingView, создатель этого скрипта сделал его открытым исходным кодом, чтобы трейдеры могли проверить и убедиться в его функциональности. Браво автору! Вы можете использовать его бесплатно, но помните, что перепубликация кода подчиняется нашим Правилам поведения.

Script Developer.
I specialize in pushing basic, fundamental concepts to their absolute limits. Dedicated to engineering noise-free indicators that reveal true market mechanics and logical edges. Clarity over https://clutter.https://www.youtube.com/@alt.analyst
I specialize in pushing basic, fundamental concepts to their absolute limits. Dedicated to engineering noise-free indicators that reveal true market mechanics and logical edges. Clarity over https://clutter.https://www.youtube.com/@alt.analyst
Отказ от ответственности
Информация и публикации не предназначены для предоставления и не являются финансовыми, инвестиционными, торговыми или другими видами советов или рекомендаций, предоставленных или одобренных TradingView. Подробнее читайте в Условиях использования.
Скрипт с открытым кодом
В истинном духе TradingView, создатель этого скрипта сделал его открытым исходным кодом, чтобы трейдеры могли проверить и убедиться в его функциональности. Браво автору! Вы можете использовать его бесплатно, но помните, что перепубликация кода подчиняется нашим Правилам поведения.
Script Developer.
I specialize in pushing basic, fundamental concepts to their absolute limits. Dedicated to engineering noise-free indicators that reveal true market mechanics and logical edges. Clarity over https://clutter.https://www.youtube.com/@alt.analyst
I specialize in pushing basic, fundamental concepts to their absolute limits. Dedicated to engineering noise-free indicators that reveal true market mechanics and logical edges. Clarity over https://clutter.https://www.youtube.com/@alt.analyst
Отказ от ответственности
Информация и публикации не предназначены для предоставления и не являются финансовыми, инвестиционными, торговыми или другими видами советов или рекомендаций, предоставленных или одобренных TradingView. Подробнее читайте в Условиях использования.