OPEN-SOURCE SCRIPT
Обновлено RSI Dav1zoN
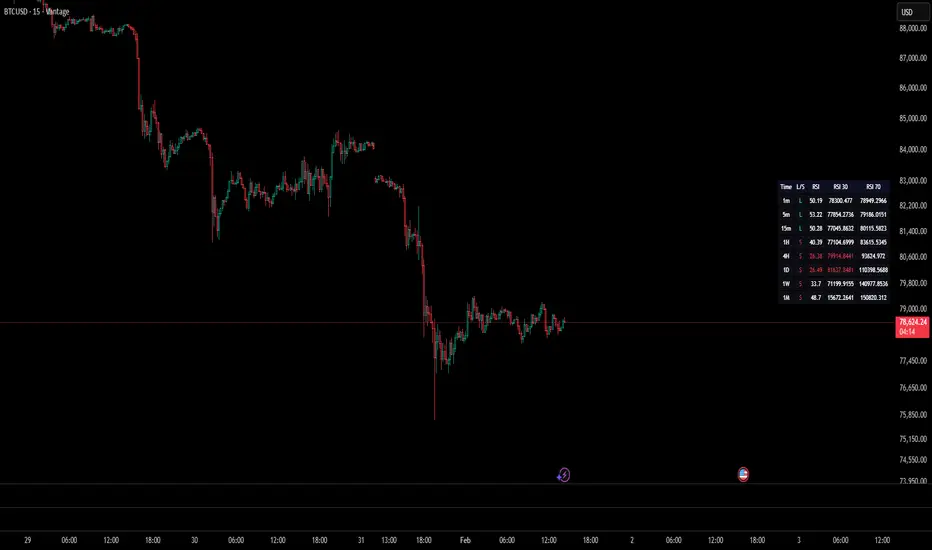
The RSI Grid is a multi-timeframe momentum dashboard designed to give a quick, structured view of market bias across several timeframes at once.
Instead of checking RSI on each timeframe manually, the grid shows direction, RSI value, and projected price levels in one place.
Instead of checking RSI on each timeframe manually, the grid shows direction, RSI value, and projected price levels in one place.
Информация о релизе
The RSI Grid is a multi-timeframe momentum dashboard designed to give a quick, structured view of market bias across several timeframes at once.Instead of checking RSI on each timeframe manually, the grid shows direction, RSI value, and projected price levels in one place.
Информация о релизе
The RSI Grid is a multi-timeframe momentum dashboard designed to give a quick, structured view of market bias across several timeframes at once.Instead of checking RSI on each timeframe manually, the grid shows direction, RSI value, and projected price levels in one place.
Информация о релизе
The RSI Grid is a multi-timeframe momentum dashboard designed to give a quick, structured view of market bias across several timeframes at once.Instead of checking RSI on each timeframe manually, the grid shows direction, RSI value, and projected price levels in one place.
Информация о релизе
COLOR UPDATE Информация о релизе
UPDATE WITH LONG SHORT AT TIMEFRAME Скрипт с открытым кодом
В истинном духе TradingView, создатель этого скрипта сделал его открытым исходным кодом, чтобы трейдеры могли проверить и убедиться в его функциональности. Браво автору! Вы можете использовать его бесплатно, но помните, что перепубликация кода подчиняется нашим Правилам поведения.

Отказ от ответственности
Информация и публикации не предназначены для предоставления и не являются финансовыми, инвестиционными, торговыми или другими видами советов или рекомендаций, предоставленных или одобренных TradingView. Подробнее читайте в Условиях использования.
Скрипт с открытым кодом
В истинном духе TradingView, создатель этого скрипта сделал его открытым исходным кодом, чтобы трейдеры могли проверить и убедиться в его функциональности. Браво автору! Вы можете использовать его бесплатно, но помните, что перепубликация кода подчиняется нашим Правилам поведения.
Отказ от ответственности
Информация и публикации не предназначены для предоставления и не являются финансовыми, инвестиционными, торговыми или другими видами советов или рекомендаций, предоставленных или одобренных TradingView. Подробнее читайте в Условиях использования.