1st 15 ORB 1/5min
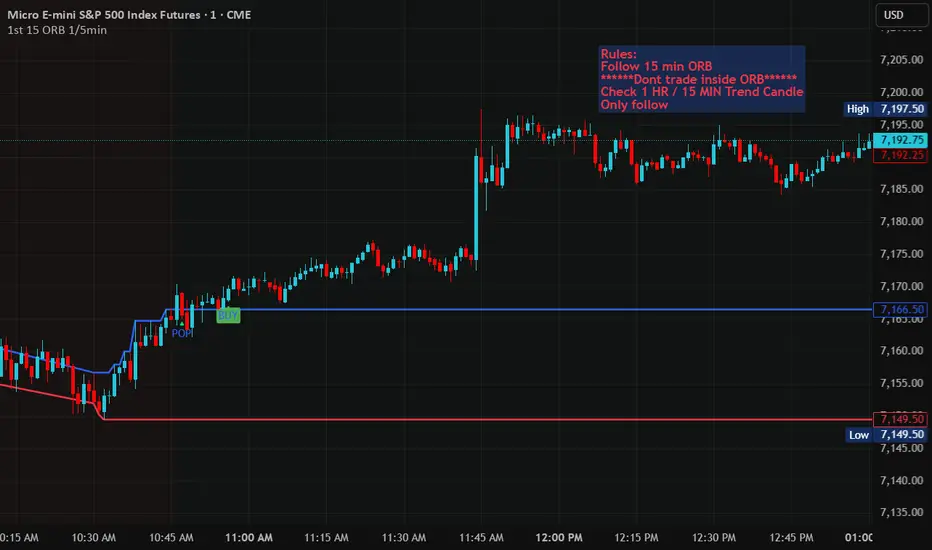
This is a:
Multi-phase Opening Range Breakout (ORB) + Trend Continuation + Compression Detection system
It breaks market behavior into 3 structured regimes:
1. Compression Phase (yellow background)
This is when:
*volatility is shrinking (ATR contraction)
*price is moving sideways
*no clear breakout yet
Meaning:
The market is “loading energy” — not moving decisively
What it is NOT:
*not a buy signal
*not a sell signal
*not directional yet
2. Breakout / Expansion Phase (ORB break)
Triggered when price breaks:
*above ORB high → bullish bias
*below ORB low → bearish bias
This is where:
*DROP / POP signals can appear (impulse moves)
*volatility expands
*direction begins to form
Meaning:
“The market chose a direction”
3. Trend Phase (background color)
After breakout:
🟩 Green = bullish trend active
🟥 Red = bearish trend active
Price is now:
*trending
*creating structure
*producing continuation setups
What each signal actually means
🔻 DROP
*aggressive sell expansion from inside ORB
*early bearish displacement
🔺 POP
*aggressive buy expansion from inside ORB
*early bullish displacement
REV (reversal)
*failed breakout at ORB boundary
*liquidity trap / rejection
CONT (continuation)
*pullback within trend
*re-entry into direction of breakout
How to use this “to the max”
This system is NOT for random entries. It is a phase-based execution model.
⚙️ Step-by-step usage model
🟨 STEP 1 — Wait for Compression
Do nothing
Identify when yellow background is active
Goal:
Let the market “build pressure”
🟦 STEP 2 — Wait for ORB break
*First break of ORB high/low defines bias
*This is your directional decision point
Rule:
You only start trading AFTER breakout
STEP 3 — Trade continuation only
Once trend is established:
Long setup:
*pullback toward structure
*continuation signal in trend direction
Short setup:
*pullback upward
*continuation down
👉 This is where consistency comes from
STEP 4 — Use DROP / POP sparingly
These are NOT primary entries.
They are:
*early expansion clues
*momentum alerts
*sometimes “first leg” entries (higher risk)
STEP 5 — REV signals = warning zones
Use REV for:
*failed breakout detection
*exit timing
*not primary entries
💡 Key concept (most important part)
This indicator is built around:
*Compression → Expansion → Trend → Continuation
Not:
*guessing tops/bottoms
*reacting to every candle
*overtrading signals
🧭 How professionals would actually use it
1. Morning (pre-breakout)
watch compression
2. First move
identify ORB breakout direction
3. Mid-session
only take continuation trades
4. Late session
stop trading unless clean structure remains
📉 What NOT to do
*don’t trade every DROP/POP
*don’t trade inside compression
*don’t counter-trade trend signals
*don’t ignore ORB bias
What makes this powerful
Most indicators try to predict moves.
This one instead:
organizes market behavior into phases so you only trade when probability is structurally in your favor.
Multi-phase Opening Range Breakout (ORB) + Trend Continuation + Compression Detection system
It breaks market behavior into 3 structured regimes:
1. Compression Phase (yellow background)
This is when:
*volatility is shrinking (ATR contraction)
*price is moving sideways
*no clear breakout yet
Meaning:
The market is “loading energy” — not moving decisively
What it is NOT:
*not a buy signal
*not a sell signal
*not directional yet
2. Breakout / Expansion Phase (ORB break)
Triggered when price breaks:
*above ORB high → bullish bias
*below ORB low → bearish bias
This is where:
*DROP / POP signals can appear (impulse moves)
*volatility expands
*direction begins to form
Meaning:
“The market chose a direction”
3. Trend Phase (background color)
After breakout:
🟩 Green = bullish trend active
🟥 Red = bearish trend active
Price is now:
*trending
*creating structure
*producing continuation setups
What each signal actually means
🔻 DROP
*aggressive sell expansion from inside ORB
*early bearish displacement
🔺 POP
*aggressive buy expansion from inside ORB
*early bullish displacement
REV (reversal)
*failed breakout at ORB boundary
*liquidity trap / rejection
CONT (continuation)
*pullback within trend
*re-entry into direction of breakout
How to use this “to the max”
This system is NOT for random entries. It is a phase-based execution model.
⚙️ Step-by-step usage model
🟨 STEP 1 — Wait for Compression
Do nothing
Identify when yellow background is active
Goal:
Let the market “build pressure”
🟦 STEP 2 — Wait for ORB break
*First break of ORB high/low defines bias
*This is your directional decision point
Rule:
You only start trading AFTER breakout
STEP 3 — Trade continuation only
Once trend is established:
Long setup:
*pullback toward structure
*continuation signal in trend direction
Short setup:
*pullback upward
*continuation down
👉 This is where consistency comes from
STEP 4 — Use DROP / POP sparingly
These are NOT primary entries.
They are:
*early expansion clues
*momentum alerts
*sometimes “first leg” entries (higher risk)
STEP 5 — REV signals = warning zones
Use REV for:
*failed breakout detection
*exit timing
*not primary entries
💡 Key concept (most important part)
This indicator is built around:
*Compression → Expansion → Trend → Continuation
Not:
*guessing tops/bottoms
*reacting to every candle
*overtrading signals
🧭 How professionals would actually use it
1. Morning (pre-breakout)
watch compression
2. First move
identify ORB breakout direction
3. Mid-session
only take continuation trades
4. Late session
stop trading unless clean structure remains
📉 What NOT to do
*don’t trade every DROP/POP
*don’t trade inside compression
*don’t counter-trade trend signals
*don’t ignore ORB bias
What makes this powerful
Most indicators try to predict moves.
This one instead:
organizes market behavior into phases so you only trade when probability is structurally in your favor.

Отказ от ответственности
Информация и публикации не предназначены для предоставления и не являются финансовыми, инвестиционными, торговыми или другими видами советов или рекомендаций, предоставленных или одобренных TradingView. Подробнее читайте в Условиях использования.
Отказ от ответственности
Информация и публикации не предназначены для предоставления и не являются финансовыми, инвестиционными, торговыми или другими видами советов или рекомендаций, предоставленных или одобренных TradingView. Подробнее читайте в Условиях использования.