Обновлено
OrderFlow Volume Support and Resistance [BigBeluga]
More exclusive indicators from BigBeluga
Subscribe to BigBeluga Premium for $66.47/month to get exclusive indicators by this author. You pay right on TradingView and can use them on your charts straight away.
Explore BigBeluga Premium🔵 OVERVIEW
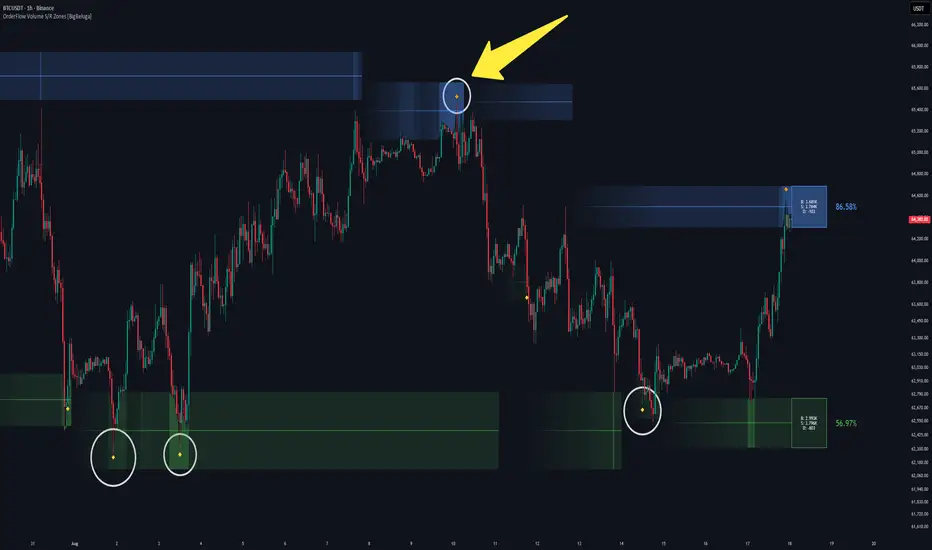
OrderFlow Volume Support and Resistance [BigBeluga] is an indicator that plots dynamic support and resistance zones based on pivot points, filtered by relative volume. It solves the problem of traditional S/R levels ignoring trading activity by only displaying zones with significant order flow, while visualizing the exact Buy, Sell, and Delta volume inside each zone. The zones dynamically fade based on proximity to price, keeping the chart clean and actionable.
 NIFTY

🔵 HOW IT WORKS
The indicator identifies key pivots, stores their volume metrics in an array, and dynamically plots only the highest-quality active zones:
1 — Pivot Array & Volume Storage
2 — Dynamic Filtering & Zone Selection
3 — Visual Proximity & Fade
4 — Retest Signals
🔵 HOW TO USE
Beyond simply mapping S/R levels, the indicator can be applied in several ways:
🔵 NOTES
Why this implementation is unique:
OrderFlow Volume Support and Resistance [BigBeluga] is an indicator that plots dynamic support and resistance zones based on pivot points, filtered by relative volume. It solves the problem of traditional S/R levels ignoring trading activity by only displaying zones with significant order flow, while visualizing the exact Buy, Sell, and Delta volume inside each zone. The zones dynamically fade based on proximity to price, keeping the chart clean and actionable.
NIFTY 🔵 HOW IT WORKS
The indicator identifies key pivots, stores their volume metrics in an array, and dynamically plots only the highest-quality active zones:
1 — Pivot Array & Volume Storage
- Pivot Scanning: Uses the Pivot Length to identify swing highs and lows.
- Order Flow Calculation: Accumulates Buy Volume (up candles) and Sell Volume (down candles) across the pivot window to calculate the net Delta.
- Dynamic Array Storage: Instead of drawing every pivot, the indicator stores every new pivot zone (including its top, bottom, and volume data) into a rolling array.
- Auto-Cleanup: Broken zones are instantly removed from the array — resistance zones are deleted when price closes above them, and support zones are removed when price closes below them.
2 — Dynamic Filtering & Zone Selection
- Volume Threshold Filter: The script scans the array for pivots that exceed the Resistance/Support Volume Threshold % (default 50%).
- Active Zone Plotting: It then dynamically plots the zone for the *most recent* pivot that passed the volume filter. This ensures your chart only shows the active, high-volume S/R zones that actually matter, rather than clutter.
- Volatility-Based Sizing: The vertical height of each zone is calculated using a 100-bar average of the candle range, ensuring zones adapt to current market volatility.
3 — Visual Proximity & Fade
- Fade-In Effect: Newly formed active zones smoothly fade in over 50 bars.
- Proximity Transparency: Zones remain semi-transparent when far from price, but become darker and more solid as price approaches the zone boundaries.
- Volume Labels: The right side of the chart displays the active zone's total volume as a percentage strength, along with a breakdown of Buy (B), Sell (S), and Delta (D) volume.
4 — Retest Signals
- Midline Retests: Prints diamond markers when price touches the zone's midline.
- Cooldown Logic: A 10-bar cooldown prevents multiple retest signals from firing during a single consolidation at the midline.
🔵 HOW TO USE
Beyond simply mapping S/R levels, the indicator can be applied in several ways:
- Trade High-Volume Zones: Treat the dynamic active zones as high-probability reversal areas. Look for price to react at the zone boundaries or the midline.
- Analyze Order Flow Delta: Read the "D" (Delta) value inside the zone. A high positive delta at resistance suggests buyers are trapped or aggressive; a high negative delta at support suggests heavy selling.
- Use Retest Diamonds: Enter trades on the diamond markers when price retests the midline, using the zone as a confirmation of interest.
- Filter Weak Levels: Increase the Volume Threshold % to force the array filter to only select zones backed by massive volume, filtering out minor swing points.
- Gauge Zone Strength: Use the percentage label on the right to compare active zones. A 90% strength zone is far more significant than a 55% zone.
🔵 NOTES
Why this implementation is unique:
- Utilizes an intelligent array-based storage system to track pivot zones and automatically remove broken ones.
- Dynamically scans the array and plots only the most recent pivot that passes the volume threshold, ensuring the chart is never cluttered with outdated or weak levels.
- Combines standard pivot S/R with order flow metrics (Buy/Sell/Delta) to reveal the intent behind the level.
- Features a smart proximity fade that keeps the chart uncluttered until price actually approaches the active zone.
- Uses dynamic zone height based on historical volatility, preventing zones from becoming too thin or excessively thick.
- Fully customizable zone colors and text sizes to match any chart theme.
Информация о релизе
- Info boxes offset 
🌐 bigbeluga.org/tv - Get access to our powerful tools & indicators.
🔵 Learn More -> docs.bigbeluga.org/
🔵 Join Discord -> go.bigbeluga.org/k65q9bfqfu
All content provided by BigBeluga is for educational purposes only
🔵 Learn More -> docs.bigbeluga.org/
🔵 Join Discord -> go.bigbeluga.org/k65q9bfqfu
All content provided by BigBeluga is for educational purposes only
Отказ от ответственности
Информация и публикации не предназначены для предоставления и не являются финансовыми, инвестиционными, торговыми или другими видами советов или рекомендаций, предоставленных или одобренных TradingView. Подробнее читайте в Условиях использования.
🌐 bigbeluga.org/tv - Get access to our powerful tools & indicators.
🔵 Learn More -> docs.bigbeluga.org/
🔵 Join Discord -> go.bigbeluga.org/k65q9bfqfu
All content provided by BigBeluga is for educational purposes only
🔵 Learn More -> docs.bigbeluga.org/
🔵 Join Discord -> go.bigbeluga.org/k65q9bfqfu
All content provided by BigBeluga is for educational purposes only
Отказ от ответственности
Информация и публикации не предназначены для предоставления и не являются финансовыми, инвестиционными, торговыми или другими видами советов или рекомендаций, предоставленных или одобренных TradingView. Подробнее читайте в Условиях использования.