OPEN-SOURCE SCRIPT
KMeans Regime Scanner [MarketFragments]
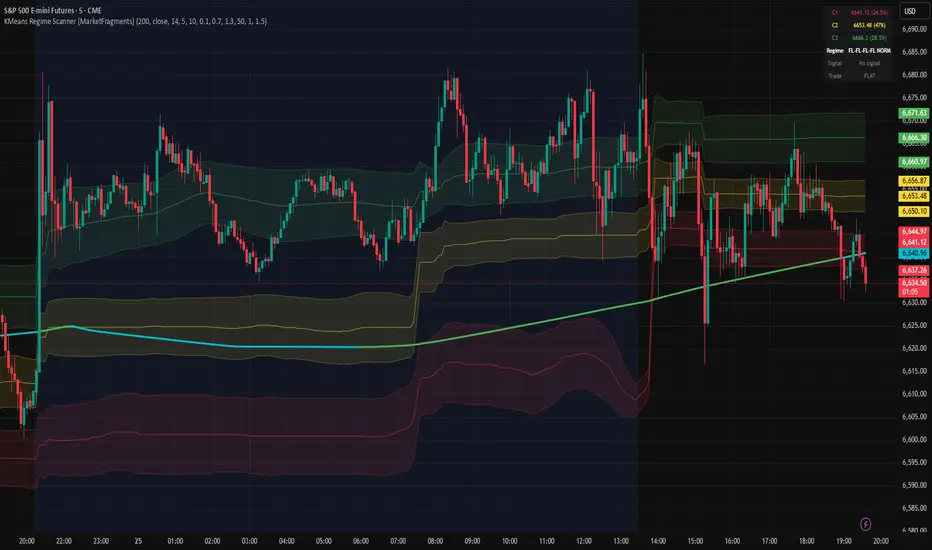
KMeans Regime Scanner [MarketFragments]
A machine learning indicator that uses K-Means clustering on price to
discover three dynamic zones, then monitors the directional behavior of
those zones to detect specific market structural patterns. Signals fire
when the bands themselves move in a specific arrangement -- not when
price crosses a band.
─────────────────────────────────────────────────────────────
HOW IT WORKS
─────────────────────────────────────────────────────────────
LAYER 1 -- K-MEANS CLUSTERING
K-Means clustering organizes closing price into 3 groups (clusters)
over a rolling 200-bar lookback window. Each cluster has a centroid
(the mean price of that group) and a standard deviation band (the
spread of prices within the group).
Centroids are initialized at the 25th, 50th, and 75th percentile of
the recent price range. All distances are normalized by ATR so the
clustering scales with current volatility rather than nominal price.
The algorithm updates every bar -- it is a fully rolling, online
implementation.
The result is three adaptive price zones:
Red band Lower cluster -- prices that have been in the lower range
Yellow band Middle cluster -- the anchor zone
Green band Upper cluster -- prices that have been in the upper range
These zones are not fixed support and resistance levels. They are
data-driven groupings that shift as price behavior changes.
LAYER 2 -- BAND STRUCTURE FEATURE EXTRACTION
Six features are computed from the cluster structure every bar:
C1 slope 10-bar slope of the lower centroid, normalized by ATR
Classified as UP, FLAT, or DOWN (threshold +/- 0.1)
C2 slope 10-bar slope of the middle centroid (same method)
C2 is the anchor -- its direction is the most important
single feature in the regime classification
C3 slope 10-bar slope of the upper centroid (same method)
Avg slope 10-bar slope of the cluster average (mean of all three)
Range state Whether the market is TRENDING, TRANSITIONING, or RANGING
Based on price distance from C2 and intra-cluster SD ratio
SD state Whether band widths are COMPRESSED, NORMAL, or EXPANDED
Ratio of current average SD to its 50-bar rolling mean
Compressed = ratio below 0.7 | Expanded = above 1.3
Combined, these six features define a regime state from a space of
3 x 3 x 3 x 3 x 2 x 3 = 486 possible combinations.
LAYER 3 -- REGIME PATTERN MATCHING
Signals fire when the current regime matches one of two long patterns
or one short pattern. These patterns were identified by analyzing which
of the 486 possible regime states historically preceded favorable
forward returns in ES 5-minute data.
Long Pattern 1:
C1 FLAT, C2 FLAT, C3 DOWN, Average DOWN, TRENDING, NORMAL SD
The upper cluster holds steady while the lower cluster contracts.
The middle band (C2) acts as an anchor -- it refuses to break.
When selling pressure at the lower boundary exhausts itself, price
tends to revert upward through the middle band.
Long Pattern 2:
C1 DOWN, C2 FLAT, C3 DOWN, Average DOWN, TRENDING, NORMAL SD
Similar structure but both outer clusters are contracting.
The key signal remains the flat middle band holding as the anchor.
Pattern stops when the lower cluster stops its downward drift.
Short Pattern:
C1 FLAT, C2 DOWN, C3 FLAT, Average FLAT, TRENDING, NORMAL SD
A weaker pattern with a different structural arrangement.
Middle band drifting lower while others hold flat.
Use selectively or skip -- fewer historical instances.
All signals fire on TRANSITION only -- the first bar the pattern
appears. Not every bar the pattern persists.
─────────────────────────────────────────────────────────────
WHAT YOU SEE ON THE CHART
─────────────────────────────────────────────────────────────
Red band + cloud Lower cluster zone (C1)
Yellow band + cloud Middle cluster zone (C2) -- the anchor
Green band + cloud Upper cluster zone (C3)
Thick colored line Cluster average
Green = trending up
Red = trending down
Cyan = neutral / flat
Green triangle up Long entry signal
Red triangle down Short entry signal (weaker -- use selectively)
Yellow line Entry price
Red line + cloud Stop loss zone
Green line + cloud Target zone
Entry label Shows cluster, stop, and target prices
Exit label Shows P&L at close
Info table Top-right -- live regime state and signal name
─────────────────────────────────────────────────────────────
RISK MANAGEMENT
─────────────────────────────────────────────────────────────
Default stop: 1.0x ATR from entry
Default target: 1.5x ATR from entry (1.5:1 reward-to-risk)
The stop is tight by design. Do not widen it. The stop placement
is part of the entry filter -- changing it alters which trades are
taken and which are skipped, changing the character of the strategy.
Stay flat when the info table shows:
SD = COMP Bands are compressed, likely a volatility squeeze
SD = EXP Volatility has already released
No signal No pattern match -- stay flat
─────────────────────────────────────────────────────────────
PARAMETERS
─────────────────────────────────────────────────────────────
Lookback 200 bars (~2.5 trading days on 5-minute charts)
K 3 (fixed -- three clusters)
Slope thresh 0.1 (ATR-normalized centroid slope cutoff)
ATR Stop 1.0x
ATR Target 1.5x
─────────────────────────────────────────────────────────────
IMPORTANT NOTES
─────────────────────────────────────────────────────────────
-- All pattern results are from historical backtesting only
-- This strategy has not been forward tested in live markets
-- Sample sizes per pattern are small -- confidence intervals are wide
-- The short pattern has a weaker historical edge -- use selectively
-- Results based on ES 5-minute continuous contract data
-- Live trading conditions including slippage will affect results
-- Past results do not guarantee future performance
-- This is not financial advice
-- Trading involves substantial risk of loss
-- Use for educational and research purposes only
─────────────────────────────────────────────────────────────
─────────────────────────────────────────────────────────────
A machine learning indicator that uses K-Means clustering on price to
discover three dynamic zones, then monitors the directional behavior of
those zones to detect specific market structural patterns. Signals fire
when the bands themselves move in a specific arrangement -- not when
price crosses a band.
─────────────────────────────────────────────────────────────
HOW IT WORKS
─────────────────────────────────────────────────────────────
LAYER 1 -- K-MEANS CLUSTERING
K-Means clustering organizes closing price into 3 groups (clusters)
over a rolling 200-bar lookback window. Each cluster has a centroid
(the mean price of that group) and a standard deviation band (the
spread of prices within the group).
Centroids are initialized at the 25th, 50th, and 75th percentile of
the recent price range. All distances are normalized by ATR so the
clustering scales with current volatility rather than nominal price.
The algorithm updates every bar -- it is a fully rolling, online
implementation.
The result is three adaptive price zones:
Red band Lower cluster -- prices that have been in the lower range
Yellow band Middle cluster -- the anchor zone
Green band Upper cluster -- prices that have been in the upper range
These zones are not fixed support and resistance levels. They are
data-driven groupings that shift as price behavior changes.
LAYER 2 -- BAND STRUCTURE FEATURE EXTRACTION
Six features are computed from the cluster structure every bar:
C1 slope 10-bar slope of the lower centroid, normalized by ATR
Classified as UP, FLAT, or DOWN (threshold +/- 0.1)
C2 slope 10-bar slope of the middle centroid (same method)
C2 is the anchor -- its direction is the most important
single feature in the regime classification
C3 slope 10-bar slope of the upper centroid (same method)
Avg slope 10-bar slope of the cluster average (mean of all three)
Range state Whether the market is TRENDING, TRANSITIONING, or RANGING
Based on price distance from C2 and intra-cluster SD ratio
SD state Whether band widths are COMPRESSED, NORMAL, or EXPANDED
Ratio of current average SD to its 50-bar rolling mean
Compressed = ratio below 0.7 | Expanded = above 1.3
Combined, these six features define a regime state from a space of
3 x 3 x 3 x 3 x 2 x 3 = 486 possible combinations.
LAYER 3 -- REGIME PATTERN MATCHING
Signals fire when the current regime matches one of two long patterns
or one short pattern. These patterns were identified by analyzing which
of the 486 possible regime states historically preceded favorable
forward returns in ES 5-minute data.
Long Pattern 1:
C1 FLAT, C2 FLAT, C3 DOWN, Average DOWN, TRENDING, NORMAL SD
The upper cluster holds steady while the lower cluster contracts.
The middle band (C2) acts as an anchor -- it refuses to break.
When selling pressure at the lower boundary exhausts itself, price
tends to revert upward through the middle band.
Long Pattern 2:
C1 DOWN, C2 FLAT, C3 DOWN, Average DOWN, TRENDING, NORMAL SD
Similar structure but both outer clusters are contracting.
The key signal remains the flat middle band holding as the anchor.
Pattern stops when the lower cluster stops its downward drift.
Short Pattern:
C1 FLAT, C2 DOWN, C3 FLAT, Average FLAT, TRENDING, NORMAL SD
A weaker pattern with a different structural arrangement.
Middle band drifting lower while others hold flat.
Use selectively or skip -- fewer historical instances.
All signals fire on TRANSITION only -- the first bar the pattern
appears. Not every bar the pattern persists.
─────────────────────────────────────────────────────────────
WHAT YOU SEE ON THE CHART
─────────────────────────────────────────────────────────────
Red band + cloud Lower cluster zone (C1)
Yellow band + cloud Middle cluster zone (C2) -- the anchor
Green band + cloud Upper cluster zone (C3)
Thick colored line Cluster average
Green = trending up
Red = trending down
Cyan = neutral / flat
Green triangle up Long entry signal
Red triangle down Short entry signal (weaker -- use selectively)
Yellow line Entry price
Red line + cloud Stop loss zone
Green line + cloud Target zone
Entry label Shows cluster, stop, and target prices
Exit label Shows P&L at close
Info table Top-right -- live regime state and signal name
─────────────────────────────────────────────────────────────
RISK MANAGEMENT
─────────────────────────────────────────────────────────────
Default stop: 1.0x ATR from entry
Default target: 1.5x ATR from entry (1.5:1 reward-to-risk)
The stop is tight by design. Do not widen it. The stop placement
is part of the entry filter -- changing it alters which trades are
taken and which are skipped, changing the character of the strategy.
Stay flat when the info table shows:
SD = COMP Bands are compressed, likely a volatility squeeze
SD = EXP Volatility has already released
No signal No pattern match -- stay flat
─────────────────────────────────────────────────────────────
PARAMETERS
─────────────────────────────────────────────────────────────
Lookback 200 bars (~2.5 trading days on 5-minute charts)
K 3 (fixed -- three clusters)
Slope thresh 0.1 (ATR-normalized centroid slope cutoff)
ATR Stop 1.0x
ATR Target 1.5x
─────────────────────────────────────────────────────────────
IMPORTANT NOTES
─────────────────────────────────────────────────────────────
-- All pattern results are from historical backtesting only
-- This strategy has not been forward tested in live markets
-- Sample sizes per pattern are small -- confidence intervals are wide
-- The short pattern has a weaker historical edge -- use selectively
-- Results based on ES 5-minute continuous contract data
-- Live trading conditions including slippage will affect results
-- Past results do not guarantee future performance
-- This is not financial advice
-- Trading involves substantial risk of loss
-- Use for educational and research purposes only
─────────────────────────────────────────────────────────────
─────────────────────────────────────────────────────────────
Скрипт с открытым кодом
В истинном духе TradingView, создатель этого скрипта сделал его открытым исходным кодом, чтобы трейдеры могли проверить и убедиться в его функциональности. Браво автору! Вы можете использовать его бесплатно, но помните, что перепубликация кода подчиняется нашим Правилам поведения.

Отказ от ответственности
Информация и публикации не предназначены для предоставления и не являются финансовыми, инвестиционными, торговыми или другими видами советов или рекомендаций, предоставленных или одобренных TradingView. Подробнее читайте в Условиях использования.
Скрипт с открытым кодом
В истинном духе TradingView, создатель этого скрипта сделал его открытым исходным кодом, чтобы трейдеры могли проверить и убедиться в его функциональности. Браво автору! Вы можете использовать его бесплатно, но помните, что перепубликация кода подчиняется нашим Правилам поведения.
Отказ от ответственности
Информация и публикации не предназначены для предоставления и не являются финансовыми, инвестиционными, торговыми или другими видами советов или рекомендаций, предоставленных или одобренных TradingView. Подробнее читайте в Условиях использования.