Step Sonar [Deriv Step Index]
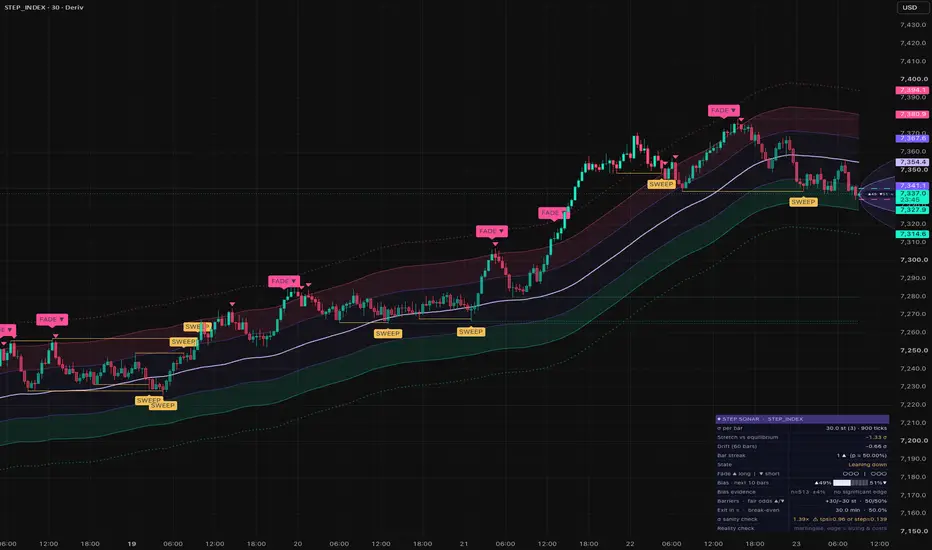
# Step Sonar | Deriv Step Index Probability & Market Structure Terminal
**A specialized statistical analysis and market visualization indicator designed for Deriv Step Indices, combining probability-based price mapping, volatility-adjusted equilibrium bands, market structure detection, historical bias analysis, and an adaptive trading dashboard.**
Step Sonar approaches Step Index analysis differently from conventional technical indicators.
Rather than relying on traditional volatility, volume, or session-based calculations, it is built around the mathematical characteristics of fixed-step synthetic price movements.
The result is a comprehensive analytical environment that helps traders understand price distribution, identify unusual deviations, evaluate market structure, and visualize potential future price ranges without presenting statistical observations as guaranteed predictions.
Built with Pine Script v6.
## Key Features
### 1. Step-Based Volatility Engine
Step Sonar uses the underlying step size and estimated tick frequency to calculate theoretical price dispersion.
For a symmetric fixed-step random walk, the standard deviation of price movement over a given number of ticks is:
**σ = Step Size × √Number of Ticks**
This provides a model-based alternative to traditional ATR calculations.
The indicator also supports an empirical volatility mode, allowing traders to calculate volatility directly from historical price changes.
A built-in calibration check compares theoretical and observed volatility to help identify potential mismatches in instrument settings.
### 2. Dynamic Equilibrium & Diffusion Bands
Step Sonar calculates a rolling price equilibrium using a Simple Moving Average (SMA), surrounded by volatility-adjusted statistical bands.
The indicator displays three configurable deviation levels:
- **±1σ Inner Bands:** Represent moderate deviations from the calculated equilibrium.
- **±2σ Outer Bands:** Highlight more pronounced price extensions.
- **±3σ Extreme Bands:** Identify statistically significant stretches relative to the selected model.
Colored zones distinguish equilibrium conditions from increasingly extended price movements.
These bands provide context for price location and dispersion rather than conventional support or resistance guarantees.
### 3. Market Stretch & Exhaustion Detection
The indicator continuously measures the distance between the current price and its rolling equilibrium in standard deviation units.
This produces a normalized stretch score that can help identify unusually extended market conditions.
Exhaustion markers appear when price re-enters the configured stretch boundary with a candle moving in the corresponding direction.
- **Bullish Exhaustion:** Price returns from an extended lower deviation.
- **Bearish Exhaustion:** Price returns from an extended upper deviation.
These markers identify specific statistical conditions, not confirmed market reversals.
### 4. Swing Levels & Liquidity Sweep Detection
Step Sonar identifies confirmed swing highs and lows and tracks their interaction with subsequent price movements.
A sweep is recognized when price:
- Moves beyond a previously identified swing level.
- Exceeds the level by a configurable minimum number of steps.
- Closes back inside the previous level.
The indicator distinguishes bullish and bearish sweep events using chart markers and highlighted levels.
Unlike conventional liquidity indicators, Step Sonar does not assume the presence of institutional order flow or actual resting liquidity. Sweeps represent observable price-action patterns.
### 5. Multi-Factor Confluence Signals
Step Sonar combines three independent conditions into a configurable confluence score:
1. **Statistical Stretch:** Price reaches an extended deviation from equilibrium.
2. **Recent Swing Sweep:** Price breaches and re-enters a confirmed swing level.
3. **Directional Streak:** Consecutive bullish or bearish candles reach an extreme threshold.
When at least two of these three conditions are satisfied, the indicator can display a FADE signal.
An optional filter requires a recent statistical stretch before a confluence signal can appear.
These signals highlight potential counter-movement setups for further evaluation, rather than automatic trade recommendations.
### 6. Forward Probability Cone
One of Step Sonar's central features is its forward-looking statistical price distribution visualization.
The indicator projects a probability cone based on the selected volatility model and the square-root-of-time relationship.
Two primary ranges are displayed:
- **±1σ:** Approximately 68% of outcomes under a normal-distribution approximation.
- **±2σ:** Approximately 95% of outcomes under the same approximation.
The cone expands as the projection horizon increases, illustrating how uncertainty grows over time.
Unlike conventional forecast indicators, the probability cone does not attempt to predict whether price will rise or fall.
It visualizes the range of possible future outcomes under the assumed random-walk model.
### 7. Fair-Odds Barrier Planner
Step Sonar includes a probability-based barrier analysis tool inspired by the classical gambler's ruin problem.
Traders can define upper and lower price barriers in step units.
The planner calculates:
- Probability of reaching the upper barrier first.
- Probability of reaching the lower barrier first.
- Expected time to reach either barrier under the model.
- Break-even win rate incorporating configurable round-trip trading costs.
For a symmetric random walk, the probability of reaching either barrier depends on the relative distances to those barriers.
The planner helps illustrate the relationship between potential reward, risk, probability, and transaction costs.
It is a mathematical planning tool, not an automated trading strategy or profitability estimator.
### 8. Historical Bias & Evidence Gauge
The indicator includes a historical measurement system that evaluates how frequently price moved higher over a selected number of subsequent bars.
Observations are grouped according to their initial statistical stretch conditions.
The dashboard displays:
- Historical upward and downward outcome frequencies.
- Approximate effective sample size.
- Confidence margin.
- An assessment of whether the observed imbalance is statistically distinguishable from 50%.
Overlapping observations are accounted for through a simplified sample-size adjustment.
**Important:** Historical outcome frequencies are descriptive, in-sample measurements. They are not calibrated probabilities of future price direction.
The indicator explicitly distinguishes between measured historical behavior and predictive certainty.
### 9. Adaptive Statistical Dashboard
Step Sonar includes a compact, customizable information terminal displaying:
- Theoretical or empirical volatility per bar.
- Current equilibrium stretch.
- Normalized directional drift.
- Consecutive candle streaks.
- Current market stretch state.
- Bullish and bearish confluence scores.
- Historical bias and evidence.
- Upper and lower barrier probabilities.
- Expected barrier exit time.
- Break-even win rate.
- Volatility calibration status.
The dashboard can be manually positioned in any chart corner.
An automatic positioning mode analyzes the visible chart area and selects a relatively unobstructed corner, helping preserve visibility of important price action.
### 10. Customizable Visual Environment
Step Sonar features a futuristic chart interface with extensive visual controls.
Customization includes:
- Bullish and bearish colors.
- Equilibrium and diffusion band colors.
- Statistical stretch highlighting.
- Dynamic candle coloring.
- Optional background tinting.
- Swing-level visibility.
- Probability cone projection length.
- Lattice grid spacing.
- Dashboard position and text size.
- Signal and alert visibility.
The lattice grid provides additional visual context by displaying horizontal price levels aligned to the configured step structure.
## How to Interpret Step Sonar
**Equilibrium Conditions**
When price remains close to its rolling equilibrium, the indicator identifies a relatively neutral statistical state.
**Extended Conditions**
When price moves beyond the configured deviation threshold, Step Sonar highlights the stretch and monitors potential exhaustion or confluence conditions.
**Sweep Events**
A swing sweep identifies a temporary breach of a previous high or low followed by a close back inside that level.
**Confluence Events**
FADE markers appear when multiple predefined market structure conditions align.
**Forward Distribution**
The probability cone illustrates possible future price dispersion, while the barrier planner provides theoretical first-passage probabilities.
**Historical Bias**
The bias gauge provides context about past outcomes under comparable stretch conditions, with an explicit indication of statistical uncertainty.
## Intended Applications
Step Sonar is designed for traders and analysts interested in:
- Statistical analysis of Deriv Step Indices.
- Random-walk price behavior.
- Volatility-normalized market structure.
- Price stretch and exhaustion analysis.
- Swing-level interactions.
- Probability-based scenario planning.
- Historical outcome measurement.
- Educational exploration of stochastic processes.
The indicator is particularly suited to studying the relationship between price movement, statistical dispersion, and trading costs.
## Important Notes & Limitations
Step Sonar is based on a symmetric fixed-step random-walk model.
Its theoretical calculations assume that individual price increments are independent, equally probable upward or downward movements of a constant size.
Users should verify the step size, tick frequency, and suitability of these assumptions for their selected instrument.
Theoretical probability ranges are model-based approximations and are not guaranteed coverage levels.
The equilibrium bands describe price deviation from a rolling average and should not be confused with unconditional future price probability intervals.
Historical bias statistics are calculated using available chart history and do not establish a persistent predictive advantage.
The indicator does not access order books, real liquidity data, or institutional positioning.
It does not execute trades or guarantee profitable outcomes.
**Step Sonar is intended for statistical visualization, technical analysis, and educational purposes. Its outputs should be interpreted as analytical context rather than financial advice or deterministic trading signals.**
---
**Developed using Pine Script v6.**
**Designed specifically for Deriv Step Indices.**
**A specialized statistical analysis and market visualization indicator designed for Deriv Step Indices, combining probability-based price mapping, volatility-adjusted equilibrium bands, market structure detection, historical bias analysis, and an adaptive trading dashboard.**
Step Sonar approaches Step Index analysis differently from conventional technical indicators.
Rather than relying on traditional volatility, volume, or session-based calculations, it is built around the mathematical characteristics of fixed-step synthetic price movements.
The result is a comprehensive analytical environment that helps traders understand price distribution, identify unusual deviations, evaluate market structure, and visualize potential future price ranges without presenting statistical observations as guaranteed predictions.
Built with Pine Script v6.
## Key Features
### 1. Step-Based Volatility Engine
Step Sonar uses the underlying step size and estimated tick frequency to calculate theoretical price dispersion.
For a symmetric fixed-step random walk, the standard deviation of price movement over a given number of ticks is:
**σ = Step Size × √Number of Ticks**
This provides a model-based alternative to traditional ATR calculations.
The indicator also supports an empirical volatility mode, allowing traders to calculate volatility directly from historical price changes.
A built-in calibration check compares theoretical and observed volatility to help identify potential mismatches in instrument settings.
### 2. Dynamic Equilibrium & Diffusion Bands
Step Sonar calculates a rolling price equilibrium using a Simple Moving Average (SMA), surrounded by volatility-adjusted statistical bands.
The indicator displays three configurable deviation levels:
- **±1σ Inner Bands:** Represent moderate deviations from the calculated equilibrium.
- **±2σ Outer Bands:** Highlight more pronounced price extensions.
- **±3σ Extreme Bands:** Identify statistically significant stretches relative to the selected model.
Colored zones distinguish equilibrium conditions from increasingly extended price movements.
These bands provide context for price location and dispersion rather than conventional support or resistance guarantees.
### 3. Market Stretch & Exhaustion Detection
The indicator continuously measures the distance between the current price and its rolling equilibrium in standard deviation units.
This produces a normalized stretch score that can help identify unusually extended market conditions.
Exhaustion markers appear when price re-enters the configured stretch boundary with a candle moving in the corresponding direction.
- **Bullish Exhaustion:** Price returns from an extended lower deviation.
- **Bearish Exhaustion:** Price returns from an extended upper deviation.
These markers identify specific statistical conditions, not confirmed market reversals.
### 4. Swing Levels & Liquidity Sweep Detection
Step Sonar identifies confirmed swing highs and lows and tracks their interaction with subsequent price movements.
A sweep is recognized when price:
- Moves beyond a previously identified swing level.
- Exceeds the level by a configurable minimum number of steps.
- Closes back inside the previous level.
The indicator distinguishes bullish and bearish sweep events using chart markers and highlighted levels.
Unlike conventional liquidity indicators, Step Sonar does not assume the presence of institutional order flow or actual resting liquidity. Sweeps represent observable price-action patterns.
### 5. Multi-Factor Confluence Signals
Step Sonar combines three independent conditions into a configurable confluence score:
1. **Statistical Stretch:** Price reaches an extended deviation from equilibrium.
2. **Recent Swing Sweep:** Price breaches and re-enters a confirmed swing level.
3. **Directional Streak:** Consecutive bullish or bearish candles reach an extreme threshold.
When at least two of these three conditions are satisfied, the indicator can display a FADE signal.
An optional filter requires a recent statistical stretch before a confluence signal can appear.
These signals highlight potential counter-movement setups for further evaluation, rather than automatic trade recommendations.
### 6. Forward Probability Cone
One of Step Sonar's central features is its forward-looking statistical price distribution visualization.
The indicator projects a probability cone based on the selected volatility model and the square-root-of-time relationship.
Two primary ranges are displayed:
- **±1σ:** Approximately 68% of outcomes under a normal-distribution approximation.
- **±2σ:** Approximately 95% of outcomes under the same approximation.
The cone expands as the projection horizon increases, illustrating how uncertainty grows over time.
Unlike conventional forecast indicators, the probability cone does not attempt to predict whether price will rise or fall.
It visualizes the range of possible future outcomes under the assumed random-walk model.
### 7. Fair-Odds Barrier Planner
Step Sonar includes a probability-based barrier analysis tool inspired by the classical gambler's ruin problem.
Traders can define upper and lower price barriers in step units.
The planner calculates:
- Probability of reaching the upper barrier first.
- Probability of reaching the lower barrier first.
- Expected time to reach either barrier under the model.
- Break-even win rate incorporating configurable round-trip trading costs.
For a symmetric random walk, the probability of reaching either barrier depends on the relative distances to those barriers.
The planner helps illustrate the relationship between potential reward, risk, probability, and transaction costs.
It is a mathematical planning tool, not an automated trading strategy or profitability estimator.
### 8. Historical Bias & Evidence Gauge
The indicator includes a historical measurement system that evaluates how frequently price moved higher over a selected number of subsequent bars.
Observations are grouped according to their initial statistical stretch conditions.
The dashboard displays:
- Historical upward and downward outcome frequencies.
- Approximate effective sample size.
- Confidence margin.
- An assessment of whether the observed imbalance is statistically distinguishable from 50%.
Overlapping observations are accounted for through a simplified sample-size adjustment.
**Important:** Historical outcome frequencies are descriptive, in-sample measurements. They are not calibrated probabilities of future price direction.
The indicator explicitly distinguishes between measured historical behavior and predictive certainty.
### 9. Adaptive Statistical Dashboard
Step Sonar includes a compact, customizable information terminal displaying:
- Theoretical or empirical volatility per bar.
- Current equilibrium stretch.
- Normalized directional drift.
- Consecutive candle streaks.
- Current market stretch state.
- Bullish and bearish confluence scores.
- Historical bias and evidence.
- Upper and lower barrier probabilities.
- Expected barrier exit time.
- Break-even win rate.
- Volatility calibration status.
The dashboard can be manually positioned in any chart corner.
An automatic positioning mode analyzes the visible chart area and selects a relatively unobstructed corner, helping preserve visibility of important price action.
### 10. Customizable Visual Environment
Step Sonar features a futuristic chart interface with extensive visual controls.
Customization includes:
- Bullish and bearish colors.
- Equilibrium and diffusion band colors.
- Statistical stretch highlighting.
- Dynamic candle coloring.
- Optional background tinting.
- Swing-level visibility.
- Probability cone projection length.
- Lattice grid spacing.
- Dashboard position and text size.
- Signal and alert visibility.
The lattice grid provides additional visual context by displaying horizontal price levels aligned to the configured step structure.
## How to Interpret Step Sonar
**Equilibrium Conditions**
When price remains close to its rolling equilibrium, the indicator identifies a relatively neutral statistical state.
**Extended Conditions**
When price moves beyond the configured deviation threshold, Step Sonar highlights the stretch and monitors potential exhaustion or confluence conditions.
**Sweep Events**
A swing sweep identifies a temporary breach of a previous high or low followed by a close back inside that level.
**Confluence Events**
FADE markers appear when multiple predefined market structure conditions align.
**Forward Distribution**
The probability cone illustrates possible future price dispersion, while the barrier planner provides theoretical first-passage probabilities.
**Historical Bias**
The bias gauge provides context about past outcomes under comparable stretch conditions, with an explicit indication of statistical uncertainty.
## Intended Applications
Step Sonar is designed for traders and analysts interested in:
- Statistical analysis of Deriv Step Indices.
- Random-walk price behavior.
- Volatility-normalized market structure.
- Price stretch and exhaustion analysis.
- Swing-level interactions.
- Probability-based scenario planning.
- Historical outcome measurement.
- Educational exploration of stochastic processes.
The indicator is particularly suited to studying the relationship between price movement, statistical dispersion, and trading costs.
## Important Notes & Limitations
Step Sonar is based on a symmetric fixed-step random-walk model.
Its theoretical calculations assume that individual price increments are independent, equally probable upward or downward movements of a constant size.
Users should verify the step size, tick frequency, and suitability of these assumptions for their selected instrument.
Theoretical probability ranges are model-based approximations and are not guaranteed coverage levels.
The equilibrium bands describe price deviation from a rolling average and should not be confused with unconditional future price probability intervals.
Historical bias statistics are calculated using available chart history and do not establish a persistent predictive advantage.
The indicator does not access order books, real liquidity data, or institutional positioning.
It does not execute trades or guarantee profitable outcomes.
**Step Sonar is intended for statistical visualization, technical analysis, and educational purposes. Its outputs should be interpreted as analytical context rather than financial advice or deterministic trading signals.**
---
**Developed using Pine Script v6.**
**Designed specifically for Deriv Step Indices.**

🔴 Deriv | Official Broker Profile
📊 Market Insights • Technical Analysis • Trading Education
📈 Exploring global markets through research, analysis and educational content.
⚠️ Trading involves risk. For informational purposes only.
📊 Market Insights • Technical Analysis • Trading Education
📈 Exploring global markets through research, analysis and educational content.
⚠️ Trading involves risk. For informational purposes only.
Отказ от ответственности
Информация и публикации не предназначены для предоставления и не являются финансовыми, инвестиционными, торговыми или другими видами советов или рекомендаций, предоставленных или одобренных TradingView. Подробнее читайте в Условиях использования.
Отказ от ответственности
Информация и публикации не предназначены для предоставления и не являются финансовыми, инвестиционными, торговыми или другими видами советов или рекомендаций, предоставленных или одобренных TradingView. Подробнее читайте в Условиях использования.