OPEN-SOURCE SCRIPT
Confluence Rank Trend Strategy [Jayadev Rana]
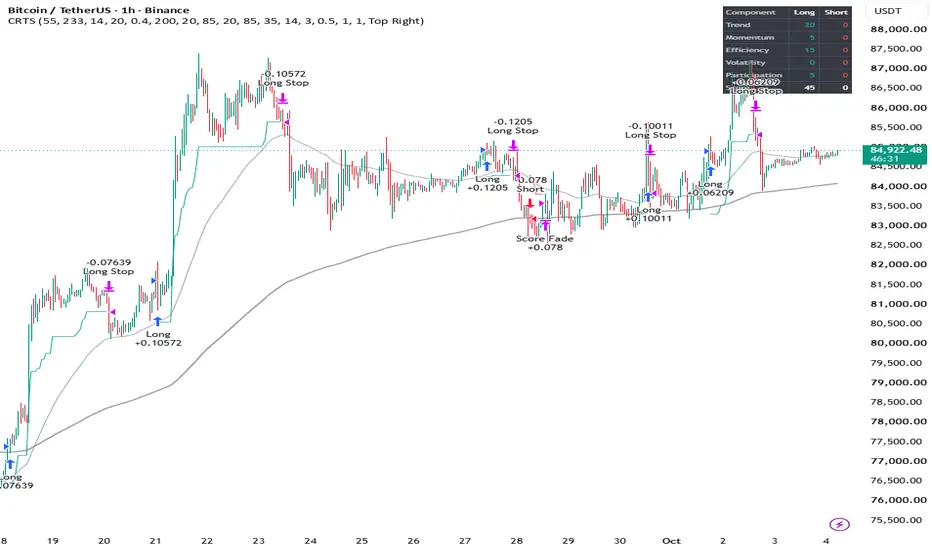
OVERVIEW
Confluence Rank Trend Strategy is a trend-following strategy that scores every bar from 0 to 100 for the long side and separately for the short side, and only opens a position when one of the two scores closes above a threshold. The same score also sets the position size: a setup that barely qualifies risks less than a setup where every component agrees.
The purpose is to replace the usual chain of yes/no filters, where one failing filter blocks a trade no matter how strong the others are, with a graded measure in which components can partly compensate for each other.
HOW THE SCORE IS BUILT
Five components contribute 0 to 20 points each:
1. Trend: 10 points when price is beyond the slow EMA, plus 10 points when the fast EMA is beyond the slow EMA.
2. Momentum: scales linearly from 0 points at RSI 50 to 20 points at RSI 70 for longs (mirrored for shorts).
3. Efficiency: the Kaufman efficiency ratio (net move divided by total path) in the trade direction, scaled so that a user-defined ratio earns the full 20 points.
4. Volatility regime: full points while the ATR percentile rank sits between a floor and a ceiling, tapering to zero when volatility is unusually dead or unusually extreme. This component is the same for both directions.
5. Participation: volume relative to its average on a bar that closes in the trade direction. Symbols without volume data receive a neutral 10 points.
ENTRIES AND EXITS
- Entry: the directional score closes at or above the Entry Score after being below it on the previous bar, and the strategy is flat. Orders are placed on the close of the signal bar and fill on the next bar open.
- Trailing stop: an ATR-multiple stop is placed at entry and then trails each new close. It only moves in the trade's favor.
- Score exit: the position is closed when its own directional score closes below the Exit Score, even if the stop has not been reached.
POSITION SIZING
Risk per trade scales linearly from the "Risk at Entry Score" value when the score equals the threshold to the "Risk at Score 100" value at a perfect score. Quantity is risk divided by the stop distance, and position notional is capped by the Maximum Leverage input.
STRATEGY PROPERTIES USED
Initial capital 10,000. Commission 0.05 percent per order. Slippage 2 ticks. No pyramiding. Margin 100 percent on both sides, maximum leverage 1. Risk per trade between 0.5 and 1 percent of equity. Entries and exits are evaluated on closed bars; calculations do not use intrabar data or higher-timeframe requests.
DEFAULT SETTINGS
The default values were chosen with a parameter search on BTCUSDT on the 1-hour timeframe using the properties above. The history was split into an earlier and a later segment and only settings that were acceptable in both segments were considered. Other symbols and timeframes will usually need different values. A parameter search always carries a risk of fitting to the tested history, so results on the tested market are likely to look better than results on new data.
DASHBOARD
A table showing the five component scores for both directions and the two totals, so it is visible at any time which component is holding a score back.
LIMITATIONS
- This is a trend-following strategy. Expect a low percentage of winning trades, with results depending on a small number of large winners. Long flat or choppy periods produce strings of small losses.
- The score is a weighted checklist, not a probability. A score of 80 does not mean an 80 percent chance of success.
- Backtests assume fills at the next bar open with fixed slippage. Real fills, funding costs on leveraged instruments, and gaps are not modeled.
- The participation component depends on the volume feed of the selected symbol and will differ between exchanges.
- Settings tuned on past data can stop working when market behavior changes.
This script is for analysis and education. It does not provide financial advice, and past performance does not guarantee future results.
Confluence Rank Trend Strategy is a trend-following strategy that scores every bar from 0 to 100 for the long side and separately for the short side, and only opens a position when one of the two scores closes above a threshold. The same score also sets the position size: a setup that barely qualifies risks less than a setup where every component agrees.
The purpose is to replace the usual chain of yes/no filters, where one failing filter blocks a trade no matter how strong the others are, with a graded measure in which components can partly compensate for each other.
HOW THE SCORE IS BUILT
Five components contribute 0 to 20 points each:
1. Trend: 10 points when price is beyond the slow EMA, plus 10 points when the fast EMA is beyond the slow EMA.
2. Momentum: scales linearly from 0 points at RSI 50 to 20 points at RSI 70 for longs (mirrored for shorts).
3. Efficiency: the Kaufman efficiency ratio (net move divided by total path) in the trade direction, scaled so that a user-defined ratio earns the full 20 points.
4. Volatility regime: full points while the ATR percentile rank sits between a floor and a ceiling, tapering to zero when volatility is unusually dead or unusually extreme. This component is the same for both directions.
5. Participation: volume relative to its average on a bar that closes in the trade direction. Symbols without volume data receive a neutral 10 points.
ENTRIES AND EXITS
- Entry: the directional score closes at or above the Entry Score after being below it on the previous bar, and the strategy is flat. Orders are placed on the close of the signal bar and fill on the next bar open.
- Trailing stop: an ATR-multiple stop is placed at entry and then trails each new close. It only moves in the trade's favor.
- Score exit: the position is closed when its own directional score closes below the Exit Score, even if the stop has not been reached.
POSITION SIZING
Risk per trade scales linearly from the "Risk at Entry Score" value when the score equals the threshold to the "Risk at Score 100" value at a perfect score. Quantity is risk divided by the stop distance, and position notional is capped by the Maximum Leverage input.
STRATEGY PROPERTIES USED
Initial capital 10,000. Commission 0.05 percent per order. Slippage 2 ticks. No pyramiding. Margin 100 percent on both sides, maximum leverage 1. Risk per trade between 0.5 and 1 percent of equity. Entries and exits are evaluated on closed bars; calculations do not use intrabar data or higher-timeframe requests.
DEFAULT SETTINGS
The default values were chosen with a parameter search on BTCUSDT on the 1-hour timeframe using the properties above. The history was split into an earlier and a later segment and only settings that were acceptable in both segments were considered. Other symbols and timeframes will usually need different values. A parameter search always carries a risk of fitting to the tested history, so results on the tested market are likely to look better than results on new data.
DASHBOARD
A table showing the five component scores for both directions and the two totals, so it is visible at any time which component is holding a score back.
LIMITATIONS
- This is a trend-following strategy. Expect a low percentage of winning trades, with results depending on a small number of large winners. Long flat or choppy periods produce strings of small losses.
- The score is a weighted checklist, not a probability. A score of 80 does not mean an 80 percent chance of success.
- Backtests assume fills at the next bar open with fixed slippage. Real fills, funding costs on leveraged instruments, and gaps are not modeled.
- The participation component depends on the volume feed of the selected symbol and will differ between exchanges.
- Settings tuned on past data can stop working when market behavior changes.
This script is for analysis and education. It does not provide financial advice, and past performance does not guarantee future results.
Скрипт с открытым кодом
В истинном духе TradingView, создатель этого скрипта сделал его открытым исходным кодом, чтобы трейдеры могли проверить и убедиться в его функциональности. Браво автору! Вы можете использовать его бесплатно, но помните, что перепубликация кода подчиняется нашим Правилам поведения.

Отказ от ответственности
Информация и публикации не предназначены для предоставления и не являются финансовыми, инвестиционными, торговыми или другими видами советов или рекомендаций, предоставленных или одобренных TradingView. Подробнее читайте в Условиях использования.
Скрипт с открытым кодом
В истинном духе TradingView, создатель этого скрипта сделал его открытым исходным кодом, чтобы трейдеры могли проверить и убедиться в его функциональности. Браво автору! Вы можете использовать его бесплатно, но помните, что перепубликация кода подчиняется нашим Правилам поведения.
Отказ от ответственности
Информация и публикации не предназначены для предоставления и не являются финансовыми, инвестиционными, торговыми или другими видами советов или рекомендаций, предоставленных или одобренных TradingView. Подробнее читайте в Условиях использования.