OPEN-SOURCE SCRIPT
Обновлено ICT Gaps
ICT Gaps
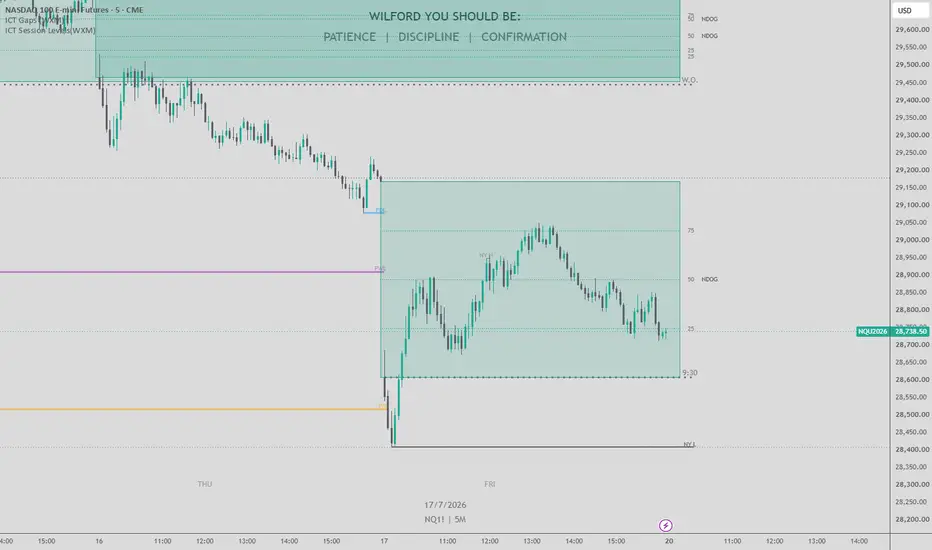
Multi-timeframe ICT gap toolkit: Fair Value Gaps from up to nine higher timeframes, plus New Week Opening Gaps (NWOG), New Day Opening Gaps (NDOG), and the Opening Range Gap (ORG) — all on one chart.
What it does
HTF Fair Value Gaps Displays FVGs (3-candle imbalances) from up to 9 configurable timeframes (defaults: 1m, 2m, 3m, 5m, 15m, 1H, 4H, 1D, 1W) on your current chart. Each timeframe has its own show/hide toggle, bullish/bearish colors, and display cap.
Zones extend a configurable distance ahead of the current candle, with each timeframe's labels stacked in its own column so you can read the chart at a glance.
Mitigation tracking with five modes: None, Wick filled, Body filled, Wick filled half, Body filled half. Mitigated zones freeze at the candle that filled them and recolor (or hide entirely — your choice).
C.E. (Consequent Encroachment) midpoint line on every FVG, with selectable line style.
Proximity filter: only FVGs within an ATR-based distance of current price are drawn, keeping the chart clean. The multiplier is adjustable.
Optional merging of back-to-back FVGs (two 3-candle gaps sharing 2 candles) into a single zone.
"Hide Lower Timeframes" automatically hides any configured timeframe below your chart timeframe.
Opening Gaps (NWOG / NDOG) The gap between Friday's close and the new week's open (NWOG), and between each day's close and the next day's open (NDOG). Keeps a configurable number of recent gaps (ICT convention: last 5). Opening gaps do not mitigate — they stay on the chart while relevant.
Opening Range Gap (ORG) The gap between the previous regular session close (default 16:15 ET) and today's regular session open (09:30 ET). The box spans exactly the overnight region — from the prior close to the opening bell — and freezes there. Session window and time-zone are configurable. Requires a 15-minute or lower chart timeframe so session boundaries align with bars.
Internal levels for gaps Each gap type can display either the C.E. midpoint or SD quadrant lines at 0/25/50/75/100% of the gap — one dropdown per feature, so the two never conflict. SD lines can carry small 25/50/75 value labels in a color of your choice.
Usage tips
Keep fill colors mostly transparent (75–90%). Opaque fills will visibly jump in front of the candles when hovered — that's TradingView's hover behavior, not the script.
If you prefer candles always on top: right-click the indicator → Visual order → Send to back.
ORG requires a 15m or lower chart. NWOG/NDOG require an intraday chart.
On a 1H chart with defaults, expect the nearest timeframe's zones to sit a few candles right of price, with higher timeframes stacked further out. Adjust "Distance from current candle" and "Spacing between timeframes" to taste.
Credits
Built on the open-source "ICT HTF FVGs" by fadizeidan, extended with additional timeframes, gap types (NWOG/NDOG/ORG), SD levels, mitigation-freeze behavior, and gap-session logic. Published under the Mozilla Public License 2.0.
This indicator is a charting tool for ICT-style analysis. It is not financial advice and produces no buy/sell signals.
Multi-timeframe ICT gap toolkit: Fair Value Gaps from up to nine higher timeframes, plus New Week Opening Gaps (NWOG), New Day Opening Gaps (NDOG), and the Opening Range Gap (ORG) — all on one chart.
What it does
HTF Fair Value Gaps Displays FVGs (3-candle imbalances) from up to 9 configurable timeframes (defaults: 1m, 2m, 3m, 5m, 15m, 1H, 4H, 1D, 1W) on your current chart. Each timeframe has its own show/hide toggle, bullish/bearish colors, and display cap.
Zones extend a configurable distance ahead of the current candle, with each timeframe's labels stacked in its own column so you can read the chart at a glance.
Mitigation tracking with five modes: None, Wick filled, Body filled, Wick filled half, Body filled half. Mitigated zones freeze at the candle that filled them and recolor (or hide entirely — your choice).
C.E. (Consequent Encroachment) midpoint line on every FVG, with selectable line style.
Proximity filter: only FVGs within an ATR-based distance of current price are drawn, keeping the chart clean. The multiplier is adjustable.
Optional merging of back-to-back FVGs (two 3-candle gaps sharing 2 candles) into a single zone.
"Hide Lower Timeframes" automatically hides any configured timeframe below your chart timeframe.
Opening Gaps (NWOG / NDOG) The gap between Friday's close and the new week's open (NWOG), and between each day's close and the next day's open (NDOG). Keeps a configurable number of recent gaps (ICT convention: last 5). Opening gaps do not mitigate — they stay on the chart while relevant.
Opening Range Gap (ORG) The gap between the previous regular session close (default 16:15 ET) and today's regular session open (09:30 ET). The box spans exactly the overnight region — from the prior close to the opening bell — and freezes there. Session window and time-zone are configurable. Requires a 15-minute or lower chart timeframe so session boundaries align with bars.
Internal levels for gaps Each gap type can display either the C.E. midpoint or SD quadrant lines at 0/25/50/75/100% of the gap — one dropdown per feature, so the two never conflict. SD lines can carry small 25/50/75 value labels in a color of your choice.
Usage tips
Keep fill colors mostly transparent (75–90%). Opaque fills will visibly jump in front of the candles when hovered — that's TradingView's hover behavior, not the script.
If you prefer candles always on top: right-click the indicator → Visual order → Send to back.
ORG requires a 15m or lower chart. NWOG/NDOG require an intraday chart.
On a 1H chart with defaults, expect the nearest timeframe's zones to sit a few candles right of price, with higher timeframes stacked further out. Adjust "Distance from current candle" and "Spacing between timeframes" to taste.
Credits
Built on the open-source "ICT HTF FVGs" by fadizeidan, extended with additional timeframes, gap types (NWOG/NDOG/ORG), SD levels, mitigation-freeze behavior, and gap-session logic. Published under the Mozilla Public License 2.0.
This indicator is a charting tool for ICT-style analysis. It is not financial advice and produces no buy/sell signals.
Информация о релизе
Changed the titleСкрипт с открытым кодом
В истинном духе TradingView, создатель этого скрипта сделал его открытым исходным кодом, чтобы трейдеры могли проверить и убедиться в его функциональности. Браво автору! Вы можете использовать его бесплатно, но помните, что перепубликация кода подчиняется нашим Правилам поведения.

Отказ от ответственности
Информация и публикации не предназначены для предоставления и не являются финансовыми, инвестиционными, торговыми или другими видами советов или рекомендаций, предоставленных или одобренных TradingView. Подробнее читайте в Условиях использования.
Скрипт с открытым кодом
В истинном духе TradingView, создатель этого скрипта сделал его открытым исходным кодом, чтобы трейдеры могли проверить и убедиться в его функциональности. Браво автору! Вы можете использовать его бесплатно, но помните, что перепубликация кода подчиняется нашим Правилам поведения.
Отказ от ответственности
Информация и публикации не предназначены для предоставления и не являются финансовыми, инвестиционными, торговыми или другими видами советов или рекомендаций, предоставленных или одобренных TradingView. Подробнее читайте в Условиях использования.