OPEN-SOURCE SCRIPT
Sweep Leg Volume Profile [Zen]
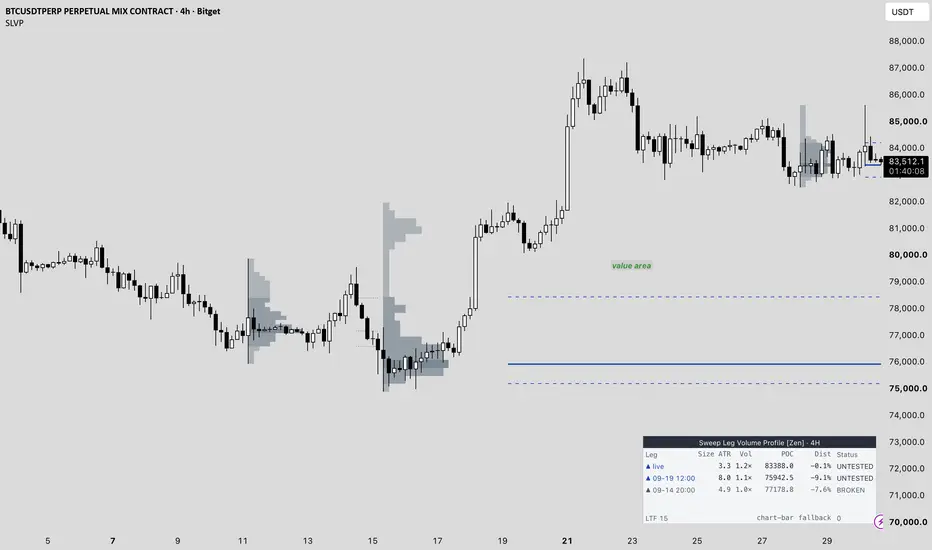
Sweep Leg Volume Profile [Zen] draws a volume profile for swing legs that started with a liquidity sweep, then tracks each leg's point of control (POC) and value area (VA) after the leg ends: UNTESTED, TESTED or BROKEN.
Settings you can change are listed under INPUTS with their defaults. ATR(14), the 100-candle volume average, the 1,500-candle history window and the Auto lower-timeframe map are fixed.
WHAT IS ORIGINAL
Swings, volume profiles and ATR are standard tools. This script combines them under one rule set:
- Only legs that started with a sweep are profiled: the swing where the leg starts took out the previous swing of the same type with its wick, and that candle or the next one closed back.
- Only legs of at least 3 x ATR(14) are kept, so small swings do not crowd the chart.
- Each profile is built from lower-timeframe candles inside the leg whenever that data is available, not from the chart candles.
- Each leg's POC and value area get a status that updates on every closed candle, with alerts.
- The developing leg is shown too. If price runs past the last swing, the previous leg is shown as still extending instead of a new leg being started.
Instead of profiling every swing, the script shows only the legs that began with a sweep of a prior swing, where volume traded inside them, and whether price has come back to those levels.
WHAT IT SHOWS
- Swings: pivot highs and lows with 5 candles on each side. A leg runs from one swing to the next opposite swing. If a higher high (up leg) or a lower low (down leg) is confirmed before the opposite swing, the leg is extended and its profile is rebuilt.
- Sweep filter: for an up leg, the starting swing low went below the previous swing low, and the same or the next candle closed above that previous low. Down legs mirror this.
- Size filter: leg range (highest high to lowest low of the leg) divided by ATR(14) on the leg's last candle must be at least 3.
- Profile: up to 24 grey rows across the leg range (rows with no volume are not drawn), drawn from the leg's first candle. The longest row is about half the leg's length (at least 5 candles, never longer than the leg). The POC row is the darkest, value area rows are medium, the rest are light.
- Levels, drawn from the leg's last candle to the right:
UNTESTED: POC is a solid line, VAH and VAL are dashed lines; blue for up legs, orange for down legs. A small "POC price" label sits at the right edge ("POC live price" for the developing leg).
TESTED: the three lines turn grey and dotted, and the label is removed.
BROKEN: grey and dotted, and the lines stop at the candle that broke the leg.
- On the chart: the 2 most recent completed legs that pass the filters (1 to 3 in Inputs) and the developing leg.
HOW THE PROFILE IS CALCULATED
- Data: lower-timeframe candles from request.security_lower_tf. Auto: a chart up to 15m uses 1m, up to 1H uses 5m, up to 4H uses 15m, up to 1D uses 60m, higher uses 240m. A manual choice of 1, 3, 5, 15, 30 or 60 minutes is possible; a choice above the chart timeframe falls back to Auto.
- The volume of each lower-timeframe candle is split equally across the rows its high-low range covers.
- If a chart candle has no lower-timeframe data, the chart candle itself is used. The table counts these candles as "chart-bar fallback".
- POC: the row with the most volume (the lower row if two are equal). Its price is the middle of the row.
- Value area: at least 70% of the leg's volume, grown row by row from the POC toward the neighbouring row with more volume. VAH and VAL are the outer edges of the value area.
STATUS
Checked on closed candles after the leg's last candle, including candles before the leg appeared on the chart:
- UNTESTED: no candle has traded at the POC since the leg ended.
- TESTED: a candle's high-low range included the POC.
- BROKEN: a candle closed beyond the far edge of the value area: below VAL for an up leg, above VAH for a down leg. A leg can go from UNTESTED straight to BROKEN. BROKEN is final.
DEVELOPING LEG
- Runs from the last confirmed swing to the furthest price reached since then in the opposite direction: from a swing high down to the lowest low, or from a swing low up to the highest high.
- If price has already moved past that swing (for example, a higher high after the last swing high), the previous leg is still extending: the developing leg is that leg up to the new extreme, and its older completed version is hidden. It comes back if the extension is not confirmed.
- It passes the same sweep and size filters, so it is not always shown.
- It is updated on closed candles and keeps changing until the next swing is confirmed.
TABLE
- One row per leg: the developing leg first, then completed legs, newest first. The hidden older version of an extending leg is not listed.
- Leg: up or down arrow and the open time (UTC) of the leg's last candle, or "live" for the developing leg.
- Size ATR: leg range / ATR(14) on the leg's last candle.
- Vol: the leg's average volume per chart candle (from the profile) / the 100-candle average volume on the leg's last candle.
- POC: price of the POC.
- Dist: distance from the current price to the POC in percent; positive means the POC is above the price.
- Status: UNTESTED, TESTED or BROKEN.
- Bottom row: the lower timeframe in use and the number of chart-bar fallback candles in the legs shown.
ALERTS
All alerts fire at candle close.
- "Any alert() function call": one message per candle that lists its events for the legs on the chart: the first touch of a POC, or a broken leg with its VAL or VAH price. Events of the developing leg are marked "live".
- Two alert conditions with fixed text: "First touch of a POC" and "Leg broken".
- Touches or breaks that happened before a leg appeared on the chart update its status but send no alert. A hidden older version of an extending leg sends no alerts.
HOW TO USE
- Use a symbol with volume data.
- Look at a recent sweep leg: where most of its volume traded (POC) and its value area.
- An UNTESTED POC is a level price has not returned to since the leg ended. TESTED and BROKEN show what happened when price came back.
- It is context for your own analysis, not an entry signal.
INPUTS (defaults)
- Completed legs on chart: 2 (1 to 3)
- Show developing leg: on
- Min leg size (x ATR): 3.0 (0 turns the size filter off)
- Only legs that start with a sweep: on
- Swing length (bars each side): 5
- Profile rows: 24
- Value area %: 70
- Lower timeframe: Auto
- Max leg length (bars): 400
- Show table: on
- Table position: top right
REALTIME BEHAVIOUR AND LIMITS
- A swing is confirmed 5 candles after it forms, so a completed leg appears 5 candles after its last candle. When a leg is extended, its previous version is replaced.
- The developing leg changes until the next swing is confirmed. After a chart reload it is rebuilt from history.
- Profiles are built only for legs that start within the last 1,500 candles (counted from the latest candle when the chart loads) and are no longer than Max leg length.
- TradingView limits how much lower-timeframe history a script receives (the limit depends on the plan), so older legs may use chart-bar fallback or may not be profiled. A finer manual lower timeframe shortens the history further.
- After a chart reload the lower-timeframe volume can differ slightly from what was received live, so the POC and the value area edges can shift slightly.
- Symbols without volume data cannot be profiled. Chart timeframes below 1 minute are not supported (the script shows an error).
- Built for standard candles. Heikin Ashi, Renko and other synthetic charts change the prices the script reads.
- Colours follow the chart theme (light or dark) automatically.
Not financial advice.
Settings you can change are listed under INPUTS with their defaults. ATR(14), the 100-candle volume average, the 1,500-candle history window and the Auto lower-timeframe map are fixed.
WHAT IS ORIGINAL
Swings, volume profiles and ATR are standard tools. This script combines them under one rule set:
- Only legs that started with a sweep are profiled: the swing where the leg starts took out the previous swing of the same type with its wick, and that candle or the next one closed back.
- Only legs of at least 3 x ATR(14) are kept, so small swings do not crowd the chart.
- Each profile is built from lower-timeframe candles inside the leg whenever that data is available, not from the chart candles.
- Each leg's POC and value area get a status that updates on every closed candle, with alerts.
- The developing leg is shown too. If price runs past the last swing, the previous leg is shown as still extending instead of a new leg being started.
Instead of profiling every swing, the script shows only the legs that began with a sweep of a prior swing, where volume traded inside them, and whether price has come back to those levels.
WHAT IT SHOWS
- Swings: pivot highs and lows with 5 candles on each side. A leg runs from one swing to the next opposite swing. If a higher high (up leg) or a lower low (down leg) is confirmed before the opposite swing, the leg is extended and its profile is rebuilt.
- Sweep filter: for an up leg, the starting swing low went below the previous swing low, and the same or the next candle closed above that previous low. Down legs mirror this.
- Size filter: leg range (highest high to lowest low of the leg) divided by ATR(14) on the leg's last candle must be at least 3.
- Profile: up to 24 grey rows across the leg range (rows with no volume are not drawn), drawn from the leg's first candle. The longest row is about half the leg's length (at least 5 candles, never longer than the leg). The POC row is the darkest, value area rows are medium, the rest are light.
- Levels, drawn from the leg's last candle to the right:
UNTESTED: POC is a solid line, VAH and VAL are dashed lines; blue for up legs, orange for down legs. A small "POC price" label sits at the right edge ("POC live price" for the developing leg).
TESTED: the three lines turn grey and dotted, and the label is removed.
BROKEN: grey and dotted, and the lines stop at the candle that broke the leg.
- On the chart: the 2 most recent completed legs that pass the filters (1 to 3 in Inputs) and the developing leg.
HOW THE PROFILE IS CALCULATED
- Data: lower-timeframe candles from request.security_lower_tf. Auto: a chart up to 15m uses 1m, up to 1H uses 5m, up to 4H uses 15m, up to 1D uses 60m, higher uses 240m. A manual choice of 1, 3, 5, 15, 30 or 60 minutes is possible; a choice above the chart timeframe falls back to Auto.
- The volume of each lower-timeframe candle is split equally across the rows its high-low range covers.
- If a chart candle has no lower-timeframe data, the chart candle itself is used. The table counts these candles as "chart-bar fallback".
- POC: the row with the most volume (the lower row if two are equal). Its price is the middle of the row.
- Value area: at least 70% of the leg's volume, grown row by row from the POC toward the neighbouring row with more volume. VAH and VAL are the outer edges of the value area.
STATUS
Checked on closed candles after the leg's last candle, including candles before the leg appeared on the chart:
- UNTESTED: no candle has traded at the POC since the leg ended.
- TESTED: a candle's high-low range included the POC.
- BROKEN: a candle closed beyond the far edge of the value area: below VAL for an up leg, above VAH for a down leg. A leg can go from UNTESTED straight to BROKEN. BROKEN is final.
DEVELOPING LEG
- Runs from the last confirmed swing to the furthest price reached since then in the opposite direction: from a swing high down to the lowest low, or from a swing low up to the highest high.
- If price has already moved past that swing (for example, a higher high after the last swing high), the previous leg is still extending: the developing leg is that leg up to the new extreme, and its older completed version is hidden. It comes back if the extension is not confirmed.
- It passes the same sweep and size filters, so it is not always shown.
- It is updated on closed candles and keeps changing until the next swing is confirmed.
TABLE
- One row per leg: the developing leg first, then completed legs, newest first. The hidden older version of an extending leg is not listed.
- Leg: up or down arrow and the open time (UTC) of the leg's last candle, or "live" for the developing leg.
- Size ATR: leg range / ATR(14) on the leg's last candle.
- Vol: the leg's average volume per chart candle (from the profile) / the 100-candle average volume on the leg's last candle.
- POC: price of the POC.
- Dist: distance from the current price to the POC in percent; positive means the POC is above the price.
- Status: UNTESTED, TESTED or BROKEN.
- Bottom row: the lower timeframe in use and the number of chart-bar fallback candles in the legs shown.
ALERTS
All alerts fire at candle close.
- "Any alert() function call": one message per candle that lists its events for the legs on the chart: the first touch of a POC, or a broken leg with its VAL or VAH price. Events of the developing leg are marked "live".
- Two alert conditions with fixed text: "First touch of a POC" and "Leg broken".
- Touches or breaks that happened before a leg appeared on the chart update its status but send no alert. A hidden older version of an extending leg sends no alerts.
HOW TO USE
- Use a symbol with volume data.
- Look at a recent sweep leg: where most of its volume traded (POC) and its value area.
- An UNTESTED POC is a level price has not returned to since the leg ended. TESTED and BROKEN show what happened when price came back.
- It is context for your own analysis, not an entry signal.
INPUTS (defaults)
- Completed legs on chart: 2 (1 to 3)
- Show developing leg: on
- Min leg size (x ATR): 3.0 (0 turns the size filter off)
- Only legs that start with a sweep: on
- Swing length (bars each side): 5
- Profile rows: 24
- Value area %: 70
- Lower timeframe: Auto
- Max leg length (bars): 400
- Show table: on
- Table position: top right
REALTIME BEHAVIOUR AND LIMITS
- A swing is confirmed 5 candles after it forms, so a completed leg appears 5 candles after its last candle. When a leg is extended, its previous version is replaced.
- The developing leg changes until the next swing is confirmed. After a chart reload it is rebuilt from history.
- Profiles are built only for legs that start within the last 1,500 candles (counted from the latest candle when the chart loads) and are no longer than Max leg length.
- TradingView limits how much lower-timeframe history a script receives (the limit depends on the plan), so older legs may use chart-bar fallback or may not be profiled. A finer manual lower timeframe shortens the history further.
- After a chart reload the lower-timeframe volume can differ slightly from what was received live, so the POC and the value area edges can shift slightly.
- Symbols without volume data cannot be profiled. Chart timeframes below 1 minute are not supported (the script shows an error).
- Built for standard candles. Heikin Ashi, Renko and other synthetic charts change the prices the script reads.
- Colours follow the chart theme (light or dark) automatically.
Not financial advice.
Скрипт с открытым кодом
В истинном духе TradingView, создатель этого скрипта сделал его открытым исходным кодом, чтобы трейдеры могли проверить и убедиться в его функциональности. Браво автору! Вы можете использовать его бесплатно, но помните, что перепубликация кода подчиняется нашим Правилам поведения.

Open-source: Untouched Levels [Zen] → tradingview.com/script/9cwR0ZIw-Untouched-Levels-Zen/ | Free: Liquidity Zones [Zen] → tradingview.com/script/aSdm5wX3-Liquidity-Zones-Zen/
Отказ от ответственности
Информация и публикации не предназначены для предоставления и не являются финансовыми, инвестиционными, торговыми или другими видами советов или рекомендаций, предоставленных или одобренных TradingView. Подробнее читайте в Условиях использования.
Скрипт с открытым кодом
В истинном духе TradingView, создатель этого скрипта сделал его открытым исходным кодом, чтобы трейдеры могли проверить и убедиться в его функциональности. Браво автору! Вы можете использовать его бесплатно, но помните, что перепубликация кода подчиняется нашим Правилам поведения.
Open-source: Untouched Levels [Zen] → tradingview.com/script/9cwR0ZIw-Untouched-Levels-Zen/ | Free: Liquidity Zones [Zen] → tradingview.com/script/aSdm5wX3-Liquidity-Zones-Zen/
Отказ от ответственности
Информация и публикации не предназначены для предоставления и не являются финансовыми, инвестиционными, торговыми или другими видами советов или рекомендаций, предоставленных или одобренных TradingView. Подробнее читайте в Условиях использования.