OPEN-SOURCE SCRIPT
Perfect Profit Benchmark
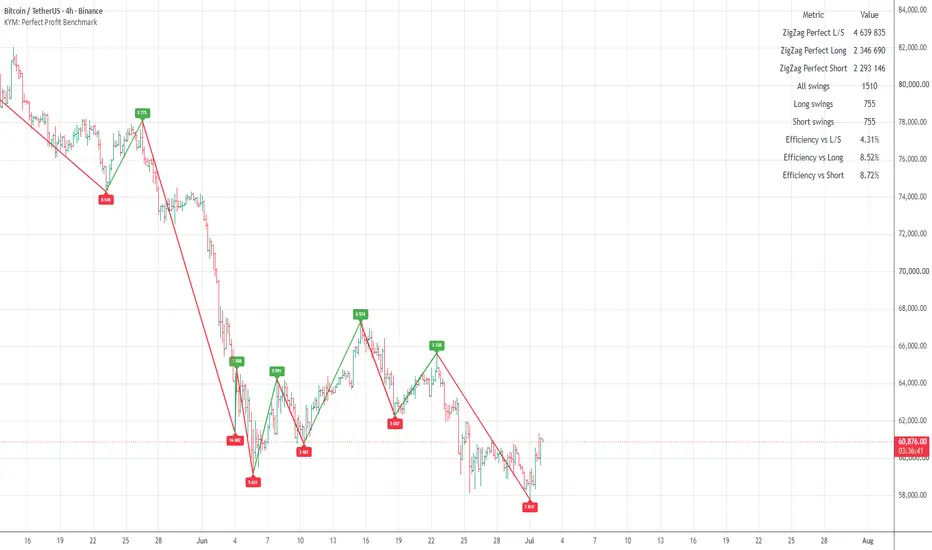
Most traders evaluate a strategy only by Net Profit, Profit Factor, or Drawdown. But these metrics do not answer the main question: how effectively did the strategy use the real opportunity provided by the market? Perfect Profit Benchmark was created for exactly this purpose — it shows not just the profit of a strategy, but its efficiency relative to the ideal swing potential of the instrument.
The script is based on the concept of Perfect Profit and Model Efficiency, described by Robert Pardo in his approach to evaluating and optimizing trading strategies. The idea is simple: over any selected period, the market contains a certain amount of potential profit. Even a perfect strategy cannot earn more than the price movement itself allowed. Therefore, it is more important to understand not only how much a strategy earned, but what share of the available market movement it was able to capture.
Pardo uses Perfect Profit as an ideal benchmark and compares the result of a real trading model against it. As a practical guideline, the author indicates that an efficiency of 5% or more of the ideal result can already be considered a strong performance level. This makes the metric especially useful: the trader receives not an abstract profit number, but a clear percentage of captured market opportunity.
Perfect Profit Benchmark measures this market capacity through ZigZag swings. The script detects confirmed pivot highs and pivot lows based on a selected reversal percentage, then calculates the ideal profit between these points. Unlike unrealistic bar-by-bar models that assume predicting every next bar, this approach evaluates the market through larger directional swings, making it much closer to real swing/trend trading logic.
The script calculates three key metrics:
ZigZag Perfect L/S — ideal performance when trading both directions, long and short.
ZigZag Perfect Long — ideal performance from upward swings only.
ZigZag Perfect Short — ideal performance from downward swings only.
The script also shows the total number of swings, the number of long swings, the number of short swings, and the efficiency percentage of your strategy relative to each ideal model. This helps identify where the strategy is stronger: in long moves, short moves, or the overall long/short market structure.
Perfect Profit Benchmark takes into account position size, point value, commission, fixed trading costs, and slippage. This makes the comparison more realistic: each swing is calculated not as raw price movement, but as potential profit after trading costs. The chart displays ZigZag lines, current direction zones, and labels showing the profit of each completed swing, allowing you to visually see where the market provided the main profit opportunities and how much of that movement an ideal model could have captured.
The main value of the script is that it gives the trader a benchmark. If a strategy earned $50,000, that number alone says little. But if the ideal swing potential of the market over the same period was $1,000,000, the strategy captured 5%. If the potential was $200,000, the strategy captured 25%. These are fundamentally different conclusions about the quality of the model.
Perfect Profit Benchmark helps separate a strong strategy from a strategy that simply benefited from a favorable market. It shows how efficiently an algorithm extracts profit from the available movement, where the return ceiling of the instrument is, and how far the current model is from ideal performance.
Test your strategy, enter its Net Profit into Perfect Profit Benchmark, and compare the result with the market’s ideal performance. This is a direct way to understand the real strength of a trading system, its share of captured market movement, and its potential for further optimization.
The script is based on the concept of Perfect Profit and Model Efficiency, described by Robert Pardo in his approach to evaluating and optimizing trading strategies. The idea is simple: over any selected period, the market contains a certain amount of potential profit. Even a perfect strategy cannot earn more than the price movement itself allowed. Therefore, it is more important to understand not only how much a strategy earned, but what share of the available market movement it was able to capture.
Pardo uses Perfect Profit as an ideal benchmark and compares the result of a real trading model against it. As a practical guideline, the author indicates that an efficiency of 5% or more of the ideal result can already be considered a strong performance level. This makes the metric especially useful: the trader receives not an abstract profit number, but a clear percentage of captured market opportunity.
Perfect Profit Benchmark measures this market capacity through ZigZag swings. The script detects confirmed pivot highs and pivot lows based on a selected reversal percentage, then calculates the ideal profit between these points. Unlike unrealistic bar-by-bar models that assume predicting every next bar, this approach evaluates the market through larger directional swings, making it much closer to real swing/trend trading logic.
The script calculates three key metrics:
ZigZag Perfect L/S — ideal performance when trading both directions, long and short.
ZigZag Perfect Long — ideal performance from upward swings only.
ZigZag Perfect Short — ideal performance from downward swings only.
The script also shows the total number of swings, the number of long swings, the number of short swings, and the efficiency percentage of your strategy relative to each ideal model. This helps identify where the strategy is stronger: in long moves, short moves, or the overall long/short market structure.
Perfect Profit Benchmark takes into account position size, point value, commission, fixed trading costs, and slippage. This makes the comparison more realistic: each swing is calculated not as raw price movement, but as potential profit after trading costs. The chart displays ZigZag lines, current direction zones, and labels showing the profit of each completed swing, allowing you to visually see where the market provided the main profit opportunities and how much of that movement an ideal model could have captured.
The main value of the script is that it gives the trader a benchmark. If a strategy earned $50,000, that number alone says little. But if the ideal swing potential of the market over the same period was $1,000,000, the strategy captured 5%. If the potential was $200,000, the strategy captured 25%. These are fundamentally different conclusions about the quality of the model.
Perfect Profit Benchmark helps separate a strong strategy from a strategy that simply benefited from a favorable market. It shows how efficiently an algorithm extracts profit from the available movement, where the return ceiling of the instrument is, and how far the current model is from ideal performance.
Test your strategy, enter its Net Profit into Perfect Profit Benchmark, and compare the result with the market’s ideal performance. This is a direct way to understand the real strength of a trading system, its share of captured market movement, and its potential for further optimization.
Скрипт с открытым кодом
В истинном духе TradingView, создатель этого скрипта сделал его открытым исходным кодом, чтобы трейдеры могли проверить и убедиться в его функциональности. Браво автору! Вы можете использовать его бесплатно, но помните, что перепубликация кода подчиняется нашим Правилам поведения.

Отказ от ответственности
Информация и публикации не предназначены для предоставления и не являются финансовыми, инвестиционными, торговыми или другими видами советов или рекомендаций, предоставленных или одобренных TradingView. Подробнее читайте в Условиях использования.
Скрипт с открытым кодом
В истинном духе TradingView, создатель этого скрипта сделал его открытым исходным кодом, чтобы трейдеры могли проверить и убедиться в его функциональности. Браво автору! Вы можете использовать его бесплатно, но помните, что перепубликация кода подчиняется нашим Правилам поведения.
Отказ от ответственности
Информация и публикации не предназначены для предоставления и не являются финансовыми, инвестиционными, торговыми или другими видами советов или рекомендаций, предоставленных или одобренных TradingView. Подробнее читайте в Условиях использования.