Rolling Volume Profile(s)
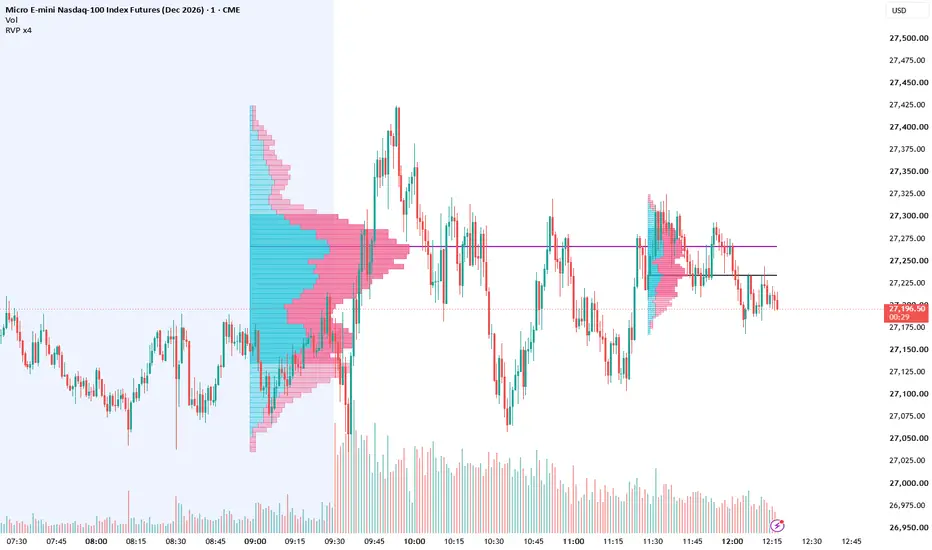
ROLLING VOLUME PROFILE x4
WHAT IT IS
A volume profile that moves with the chart. Up to four profiles can be shown at once, each built from the last N candles you choose (for example 100, 200, 300 and 500). Each profile always ends on the current candle, so it shows where volume has traded over a recent, fixed number of candles rather than a fixed session or a range you draw by hand.
WHAT IT DOES
- Draws a volume histogram (Up/Down, Total, or Delta) for each active profile.
- Marks each profile's Point of Control (POC), with its own color per profile.
- Optionally shows the Value Area High (VAH) and Value Area Low (VAL).
- Optionally plots the Developing POC and Developing Value Area, showing how those levels moved candle by candle.
- Shows the current POC, VAH and VAL of every profile in the Data Window.
HOW IT WORKS
- Window: each profile covers the last N candles, including the current one. When a new candle opens, the oldest candle drops out. The current candle is recalculated on every tick.
- Volume distribution: each candle's volume is spread evenly across its high-low range and divided among the price rows it touches. A candle counts as Up volume when close >= open, and Down volume when close < open.
- POC: the row with the highest total volume.
- Value Area: starting at the POC, rows are added one at a time (whichever neighbor, above or below, has more volume) until the Value Area percentage of total volume is reached.
- Settings follow TradingView's Fixed Range Volume Profile. FRVP uses lower-timeframe data, while this script uses the chart's own candles, so row values will be close to FRVP but not identical.
- Row limit: TradingView allows 500 boxes per indicator, shared by all profiles. Each row uses up to 2 boxes, so the maximum rows per profile drop automatically as more profiles are turned on: about 240 rows with 1 profile, 125 with 2, 83 with 3 and 62 with 4.
SETTINGS
Profiles
- Profile 1-4: turn each profile on or off, set its number of candles (2-5000), and choose its POC color.
Inputs (apply to all profiles)
- Rows Layout: "Number of Rows" sets a fixed row count; "Ticks Per Row" sets a fixed row height in ticks.
- Row Size: the number of rows or the ticks per row, depending on Rows Layout. Reduced automatically when needed to stay under the 500-box limit.
- Volume: Up/Down (two-color bars), Total (one bar), or Delta (Up minus Down, colored by the larger side).
- Value Area Volume: the percentage of total volume inside the Value Area (default 70).
- Extend Right: extends the POC, VAH and VAL lines to the right edge of the chart.
Style
- Volume profile: show or hide the histogram.
- Values: show the volume number at the end of each row, with your choice of color.
- Width (% of the box): how far the longest row reaches across the profile's candle range.
- Placement: anchor the histogram to the Left or Right side of the window.
- Up Volume / Down Volume / Value Area Up / Value Area Down: row colors inside and outside the Value Area.
- VAH / VAL: show the lines and set color, width and style (Solid, Dashed, Dotted).
- POC: show the line and set width and style (the color is set per profile).
- Developing POC: plots each profile's POC as it moved, in that profile's POC color.
- Developing VA: plots the developing VAH and VAL, with your choice of color.
- Developing lines: candles back: how far back the developing lines are drawn. Higher values take longer to load.
- Histogram Box: draws a shaded box around each profile's full price range and candle window.
TIPS
- Use different candle counts to compare short-term and longer-term volume areas, for example where a short-term POC sits against a longer-term POC.
- With 3 or 4 profiles on, give each POC a distinct color so the lines are easy to tell apart.
- If loading feels slow, reduce "Developing lines: candles back" or turn the developing lines off.
WHAT IT IS
A volume profile that moves with the chart. Up to four profiles can be shown at once, each built from the last N candles you choose (for example 100, 200, 300 and 500). Each profile always ends on the current candle, so it shows where volume has traded over a recent, fixed number of candles rather than a fixed session or a range you draw by hand.
WHAT IT DOES
- Draws a volume histogram (Up/Down, Total, or Delta) for each active profile.
- Marks each profile's Point of Control (POC), with its own color per profile.
- Optionally shows the Value Area High (VAH) and Value Area Low (VAL).
- Optionally plots the Developing POC and Developing Value Area, showing how those levels moved candle by candle.
- Shows the current POC, VAH and VAL of every profile in the Data Window.
HOW IT WORKS
- Window: each profile covers the last N candles, including the current one. When a new candle opens, the oldest candle drops out. The current candle is recalculated on every tick.
- Volume distribution: each candle's volume is spread evenly across its high-low range and divided among the price rows it touches. A candle counts as Up volume when close >= open, and Down volume when close < open.
- POC: the row with the highest total volume.
- Value Area: starting at the POC, rows are added one at a time (whichever neighbor, above or below, has more volume) until the Value Area percentage of total volume is reached.
- Settings follow TradingView's Fixed Range Volume Profile. FRVP uses lower-timeframe data, while this script uses the chart's own candles, so row values will be close to FRVP but not identical.
- Row limit: TradingView allows 500 boxes per indicator, shared by all profiles. Each row uses up to 2 boxes, so the maximum rows per profile drop automatically as more profiles are turned on: about 240 rows with 1 profile, 125 with 2, 83 with 3 and 62 with 4.
SETTINGS
Profiles
- Profile 1-4: turn each profile on or off, set its number of candles (2-5000), and choose its POC color.
Inputs (apply to all profiles)
- Rows Layout: "Number of Rows" sets a fixed row count; "Ticks Per Row" sets a fixed row height in ticks.
- Row Size: the number of rows or the ticks per row, depending on Rows Layout. Reduced automatically when needed to stay under the 500-box limit.
- Volume: Up/Down (two-color bars), Total (one bar), or Delta (Up minus Down, colored by the larger side).
- Value Area Volume: the percentage of total volume inside the Value Area (default 70).
- Extend Right: extends the POC, VAH and VAL lines to the right edge of the chart.
Style
- Volume profile: show or hide the histogram.
- Values: show the volume number at the end of each row, with your choice of color.
- Width (% of the box): how far the longest row reaches across the profile's candle range.
- Placement: anchor the histogram to the Left or Right side of the window.
- Up Volume / Down Volume / Value Area Up / Value Area Down: row colors inside and outside the Value Area.
- VAH / VAL: show the lines and set color, width and style (Solid, Dashed, Dotted).
- POC: show the line and set width and style (the color is set per profile).
- Developing POC: plots each profile's POC as it moved, in that profile's POC color.
- Developing VA: plots the developing VAH and VAL, with your choice of color.
- Developing lines: candles back: how far back the developing lines are drawn. Higher values take longer to load.
- Histogram Box: draws a shaded box around each profile's full price range and candle window.
TIPS
- Use different candle counts to compare short-term and longer-term volume areas, for example where a short-term POC sits against a longer-term POC.
- With 3 or 4 profiles on, give each POC a distinct color so the lines are easy to tell apart.
- If loading feels slow, reduce "Developing lines: candles back" or turn the developing lines off.

Отказ от ответственности
Информация и публикации не предназначены для предоставления и не являются финансовыми, инвестиционными, торговыми или другими видами советов или рекомендаций, предоставленных или одобренных TradingView. Подробнее читайте в Условиях использования.
Отказ от ответственности
Информация и публикации не предназначены для предоставления и не являются финансовыми, инвестиционными, торговыми или другими видами советов или рекомендаций, предоставленных или одобренных TradingView. Подробнее читайте в Условиях использования.