Обновлено
Investep Volume + Worden (1H :00 RTH/ETH)
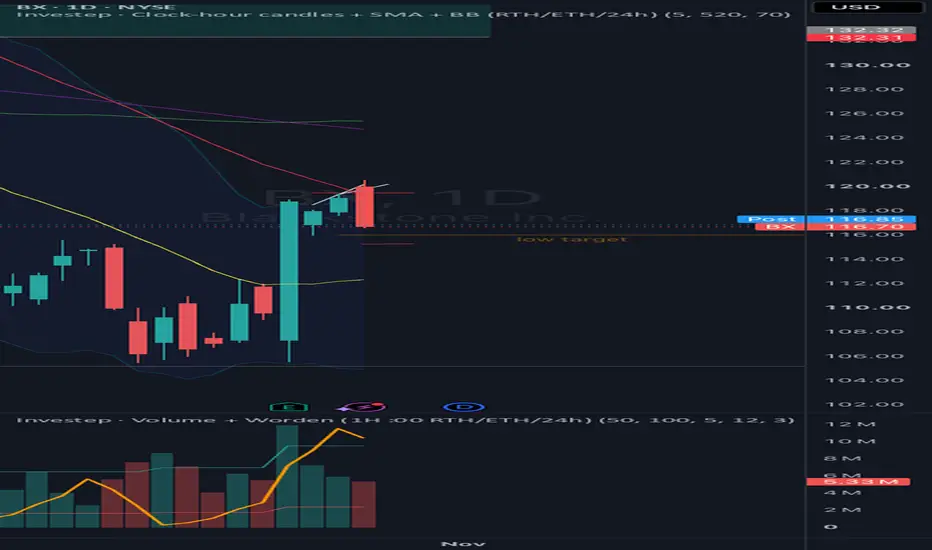
# Investep Clock-Hour Volume and Worden
Investep Clock-Hour Volume and Worden combines actual volume columns with a close-price percentile oscillator in one pane. Its purpose is to compare participation and the relative rank of closing prices over the same bar intervals, including reconstructed clock-hour blocks on regular-session 1H charts.
## Data and intervals
On a regular-session 60-minute chart, the script sums regular-session intrabar volume and reconstructs opening and closing prices for clock-hour blocks. For a normal US equity session, these are 09:30–10:00, 10:00–11:00, and so on through 15:00–16:00. The first block is partial. Premarket and after-hours are excluded, and early-close handling depends on the provider's session flags.
On all other timeframes, including 1H with Extended hours enabled, the script uses the chart's own open, close and volume without an additional regular-session filter. The intrabar setting affects only regular-session 1H reconstruction. On synthetic charts, this native path uses the values supplied by that chart.
## Worden calculation
With the default period of 12, each candidate close is compared with the previous 11 closes. Each lower prior close contributes one point and each equal prior close contributes half a point. The total is divided by 11 and expressed as a percentage. A simple average of three consecutive ranks produces the default smoothed value. Period and smoothing are configurable; the defaults require 14 bars for the first smoothed result.
This is a close-price percentile rank, not the high-low stochastic formula. Volume does not enter its calculation. Values near 80 or 20 indicate a relatively high or low closing-price rank within the lookback; these reference levels are not automatic entry or exit signals.
## Reading the shared pane
Volume columns use actual provider volume units, such as shares for equities. Teal (#26A69A) means close is at or above open; red (#EF5350) means close is below open. Columns are translucent so the orange Worden line remains visible.
The vertical axis is volume, not a 0–100 oscillator axis. To share that axis, the script positions Worden and its 80/20 reference lines relative to the rolling peak volume, using a default lookback of 50 chart bars. With the default height of 100, Worden 100 is positioned at the rolling volume maximum. A height of 50 places that volume maximum halfway up the oscillator's visual range. Changing these display settings does not change actual volume or the calculated Worden value.
Read the true 0–100 oscillator value from the status line or Data Window field named Worden. The field Worden (on volume axis) is a drawing position. The fields Volume (actual; 1H shifted) and Native chart volume (unshifted) allow interval-aware volume comparisons.
## How to use it and limitations
Add one instance to the chart. Choose the timeframe and session first, then adjust the Worden period/smoothing and volume display settings if needed. The indicator works independently; when used alongside Investep Clock-Hour Candles, regular-session 1H volume and price refer to the same reconstructed intervals.
The useful combination is interval-consistent volume and closing-price rank in one pane. A native 09:30–10:30 volume bar and a reconstructed 09:30–10:00 block cover different periods, so their totals are not expected to match. The script does not change the chart's horizontal timestamps.
Developing values can change before their bar closes. Intrabar limits and provider data determine historical coverage. The rolling volume maximum can move the displayed oscillator and reference lines in steps without changing their relative 0–100 relationship. When peak volume is missing or nonpositive, the oscillator cannot be positioned on the volume axis; its calculated rank may still be available in the status line/Data Window. Missing volume is not replaced with invented activity. This indicator does not submit orders, issue service alerts or claim predictive performance.
Investep Clock-Hour Volume and Worden combines actual volume columns with a close-price percentile oscillator in one pane. Its purpose is to compare participation and the relative rank of closing prices over the same bar intervals, including reconstructed clock-hour blocks on regular-session 1H charts.
## Data and intervals
On a regular-session 60-minute chart, the script sums regular-session intrabar volume and reconstructs opening and closing prices for clock-hour blocks. For a normal US equity session, these are 09:30–10:00, 10:00–11:00, and so on through 15:00–16:00. The first block is partial. Premarket and after-hours are excluded, and early-close handling depends on the provider's session flags.
On all other timeframes, including 1H with Extended hours enabled, the script uses the chart's own open, close and volume without an additional regular-session filter. The intrabar setting affects only regular-session 1H reconstruction. On synthetic charts, this native path uses the values supplied by that chart.
## Worden calculation
With the default period of 12, each candidate close is compared with the previous 11 closes. Each lower prior close contributes one point and each equal prior close contributes half a point. The total is divided by 11 and expressed as a percentage. A simple average of three consecutive ranks produces the default smoothed value. Period and smoothing are configurable; the defaults require 14 bars for the first smoothed result.
This is a close-price percentile rank, not the high-low stochastic formula. Volume does not enter its calculation. Values near 80 or 20 indicate a relatively high or low closing-price rank within the lookback; these reference levels are not automatic entry or exit signals.
## Reading the shared pane
Volume columns use actual provider volume units, such as shares for equities. Teal (#26A69A) means close is at or above open; red (#EF5350) means close is below open. Columns are translucent so the orange Worden line remains visible.
The vertical axis is volume, not a 0–100 oscillator axis. To share that axis, the script positions Worden and its 80/20 reference lines relative to the rolling peak volume, using a default lookback of 50 chart bars. With the default height of 100, Worden 100 is positioned at the rolling volume maximum. A height of 50 places that volume maximum halfway up the oscillator's visual range. Changing these display settings does not change actual volume or the calculated Worden value.
Read the true 0–100 oscillator value from the status line or Data Window field named Worden. The field Worden (on volume axis) is a drawing position. The fields Volume (actual; 1H shifted) and Native chart volume (unshifted) allow interval-aware volume comparisons.
## How to use it and limitations
Add one instance to the chart. Choose the timeframe and session first, then adjust the Worden period/smoothing and volume display settings if needed. The indicator works independently; when used alongside Investep Clock-Hour Candles, regular-session 1H volume and price refer to the same reconstructed intervals.
The useful combination is interval-consistent volume and closing-price rank in one pane. A native 09:30–10:30 volume bar and a reconstructed 09:30–10:00 block cover different periods, so their totals are not expected to match. The script does not change the chart's horizontal timestamps.
Developing values can change before their bar closes. Intrabar limits and provider data determine historical coverage. The rolling volume maximum can move the displayed oscillator and reference lines in steps without changing their relative 0–100 relationship. When peak volume is missing or nonpositive, the oscillator cannot be positioned on the volume axis; its calculated rank may still be available in the status line/Data Window. Missing volume is not replaced with invented activity. This indicator does not submit orders, issue service alerts or claim predictive performance.
Информация о релизе
Update to the 24 hour session so that Volume shows upИнформация о релизе
Prevent the developing final RTH clock-hour candle from appearing twice before the session closes. The last intrabar's session flag identifies its position, not whether it is confirmed; treating it as complete can display the same 15:00–16:00 hour in both the completed slot and a new LIVE slot.
Отказ от ответственности
Информация и публикации не предназначены для предоставления и не являются финансовыми, инвестиционными, торговыми или другими видами советов или рекомендаций, предоставленных или одобренных TradingView. Подробнее читайте в Условиях использования.
Отказ от ответственности
Информация и публикации не предназначены для предоставления и не являются финансовыми, инвестиционными, торговыми или другими видами советов или рекомендаций, предоставленных или одобренных TradingView. Подробнее читайте в Условиях использования.