Correction Regime (TEMA/EMA) [C0de Master]
What It Is
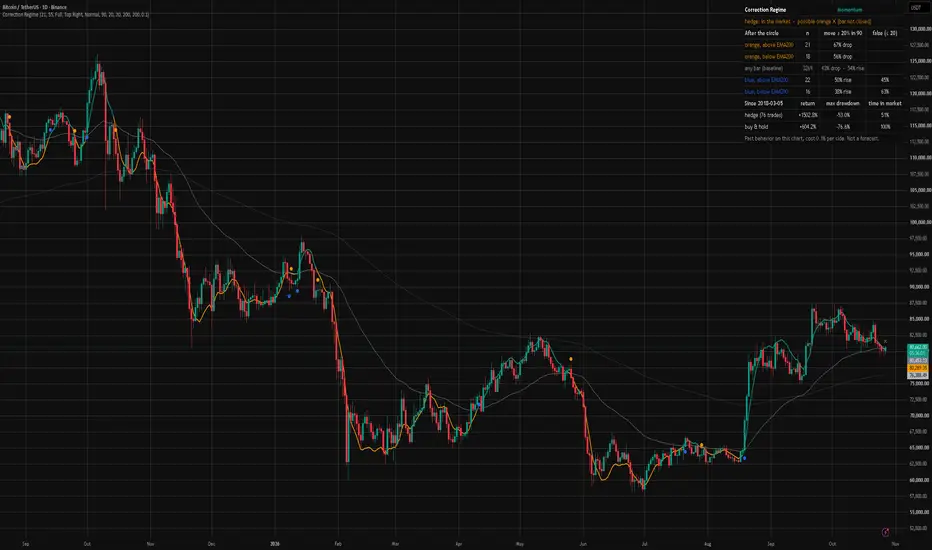
A trend-regime tool that shows when the market shifts between Momentum and Correction. It is built on a simple, well-known idea: a crossover between a fast TEMA(21) and an EMA(55).
No hidden logic. What it gives you: circles that never repaint, and a panel that calculates the history of these circles on any symbol you open, so you can judge it yourself.
Why TEMA 21 / EMA 55?
On daily crypto charts, this pair sat at the top of the moving-average family. Slow rules like the Golden Cross or the 200 SMA react far too late. To be honest, it is not unique: price above EMA55 gives similar results, but with about 2.5× more signals. The TEMA's job is fewer, calmer circles. What really matters is the speed, roughly 21 to 55 bars.
(Earlier versions added Stoch RSI, volume, ATR and higher-timeframe filters. Tested against the plain crossover, they made it worse, so they were removed.)
What the History Shows
The Blue Circle Is Not a Buy Signal on Its Own
Buying just because a blue circle appeared and holding was no better than buying on any day of the correction. About half of blue circles are followed by a new orange one within 20 bars, and more often when price is below the 200 EMA. Its real value: the re-entry point after an orange exit, because the next orange circle cuts false blues short.
The Panel
Calculated live for every symbol you open:
If the orange rate on your symbol is not clearly above the "any bar" line, the indicator has no edge there.
Non-Repainting
Circles are confirmed on the bar close. On the live bar a faint ✕ marks a possible circle; it is not counted and may disappear before the close. Alerts fire only on confirmed circles.
How to Use It
Settings
TEMA / EMA lengths (only 21 / 55 were tested), close confirmation, panel mode and position, look-ahead window, size of a "large move", false-blue window, context EMA, cost per side.
Disclaimer
An analysis tool, not financial or investment advice. The results above are historical and exploratory, with small samples, and do not guarantee the future. The hedge simulation includes a fixed 0.1% cost per side but ignores slippage, funding and taxes. Use it with your own risk management.
A trend-regime tool that shows when the market shifts between Momentum and Correction. It is built on a simple, well-known idea: a crossover between a fast TEMA(21) and an EMA(55).
- Orange circle: TEMA crosses below EMA. A correction regime starts.
- Blue circle: TEMA crosses back above EMA. The correction ends.
No hidden logic. What it gives you: circles that never repaint, and a panel that calculates the history of these circles on any symbol you open, so you can judge it yourself.
Why TEMA 21 / EMA 55?
On daily crypto charts, this pair sat at the top of the moving-average family. Slow rules like the Golden Cross or the 200 SMA react far too late. To be honest, it is not unique: price above EMA55 gives similar results, but with about 2.5× more signals. The TEMA's job is fewer, calmer circles. What really matters is the speed, roughly 21 to 55 bars.
(Earlier versions added Stoch RSI, volume, ATR and higher-timeframe filters. Tested against the plain crossover, they made it worse, so they were removed.)
What the History Shows
- On daily BTC: after an orange circle above the 200 EMA, price dropped a further 20%+ within 90 bars in 14 of 21 cases (67%). For any random bar the rate was 43%. A small sample, but a clear gap.
- About a third of orange circles did not lead to a drop. They were followed by sideways accumulation and a strong rally. The indicator cannot tell these apart in advance: it shows past frequencies, not a forecast.
- A simple hedge (exit at the next open after an orange circle, re-enter after a blue one) cut the max drawdown on BTC, ETH, SOL, TOTAL2, TOTAL3 and 53 of 56 coins compared with buy-and-hold.
- The price you pay: the hedge usually earns less than buy-and-hold in strong bull years, and its edge has been weaker since 2023.
- On altcoins, most of the benefit comes from the fact that altcoins tend to bleed. Almost any exit helps there.
- Built for the daily chart. On 3-day and weekly charts the cross arrives too late.
The Blue Circle Is Not a Buy Signal on Its Own
Buying just because a blue circle appeared and holding was no better than buying on any day of the correction. About half of blue circles are followed by a new orange one within 20 bars, and more often when price is below the 200 EMA. Its real value: the re-entry point after an orange exit, because the next orange circle cuts false blues short.
The Panel
Calculated live for every symbol you open:
- Compact (default): market state, hedge status, the drop rate after orange circles (above / below EMA200, next to any bar), and the false-blue rate.
- Full: the same as a table with sample sizes, plus hedge vs buy-and-hold since the start date: return, max drawdown, number of trades and time in the market.
If the orange rate on your symbol is not clearly above the "any bar" line, the indicator has no edge there.
Non-Repainting
Circles are confirmed on the bar close. On the live bar a faint ✕ marks a possible circle; it is not counted and may disappear before the close. Alerts fire only on confirmed circles.
How to Use It
- Use it on the daily chart.
- Read the market state first: Momentum or Correction.
- A confirmed orange circle is a signal to reduce exposure or move to cash, not to open a short. If you hedge, act at the next open.
- A confirmed blue circle ends the correction: a re-entry for those who exited, not a stand-alone buy.
- Watch the dotted 200 EMA: circles above it behaved very differently from circles below it.
- Check your own symbol in the Full panel before relying on it.
- Alerts are available for confirmed orange and blue circles.
Settings
TEMA / EMA lengths (only 21 / 55 were tested), close confirmation, panel mode and position, look-ahead window, size of a "large move", false-blue window, context EMA, cost per side.
Disclaimer
An analysis tool, not financial or investment advice. The results above are historical and exploratory, with small samples, and do not guarantee the future. The hedge simulation includes a fixed 0.1% cost per side but ignores slippage, funding and taxes. Use it with your own risk management.

Отказ от ответственности
Информация и публикации не предназначены для предоставления и не являются финансовыми, инвестиционными, торговыми или другими видами советов или рекомендаций, предоставленных или одобренных TradingView. Подробнее читайте в Условиях использования.
Отказ от ответственности
Информация и публикации не предназначены для предоставления и не являются финансовыми, инвестиционными, торговыми или другими видами советов или рекомендаций, предоставленных или одобренных TradingView. Подробнее читайте в Условиях использования.