OPEN-SOURCE SCRIPT
Aruj's OBV
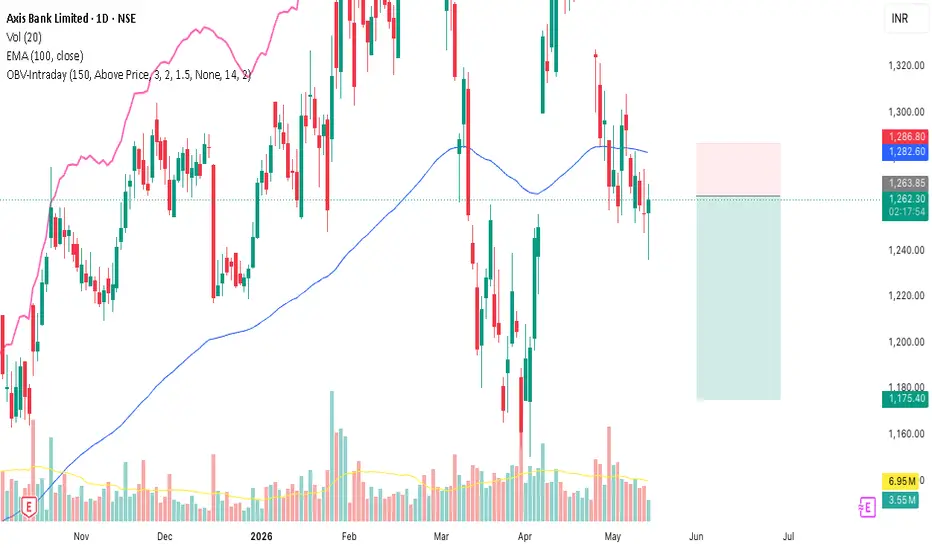
On-Balance Volume (OBV) is a momentum indicator that adds volume on up-closes and subtracts it on down-closes, giving you a running measure of whether volume is flowing into or out of an instrument. The idea: volume often moves before price, so OBV can hint at conviction behind a move — or warn of divergence when price and OBV disagree.
This indicator does one thing differently: instead of sitting in a separate pane, OBV is rescaled and plotted directly on the price chart as an overlay. You read volume flow and candles in the same glance — useful for intraday, where switching focus between panes costs you.
How it works
The raw OBV is normalized to a 0–1 range over a configurable lookback, then mapped onto a band that's anchored to a short 20-EMA of price and sized using ATR. The result is an OBV "wave" that hugs the candles and auto-adjusts to recent volatility, so it stays readable whether the instrument is quiet or trending hard.
Settings
Scaling & Position
Lookback Period — bars used to normalize OBV. Smaller is more reactive; ~100 for 5m, ~150 for 15m.
Anchor Position — place the OBV wave above, below, or centered on price.
Auto-Fit Height (ATR) — sizes the wave to recent volatility. Recommended ON for intraday.
Height Multiplier / Height % — controls wave amplitude (ATR mode vs. manual mode).
Offset Distance — how far the wave sits from the candles.
Smoothing
Optional moving average over OBV — SMA, EMA, SMMA (RMA), WMA, or VWMA.
SMA + Bollinger Bands adds volatility bands around the OBV MA to flag when volume flow is stretched.
How to read it
Watch the shape, not the absolute value (it's normalized). OBV rising while price stalls = accumulation building. OBV falling into a price high = bearish divergence, momentum may be hollow. The smoothing MA helps filter noise on lower timeframes.
Notes
Requires an instrument with real volume data — won't work on feeds that don't supply volume. Tuned for intraday but works on any timeframe. Open-source — feel free to learn from it or adapt it.
This indicator does one thing differently: instead of sitting in a separate pane, OBV is rescaled and plotted directly on the price chart as an overlay. You read volume flow and candles in the same glance — useful for intraday, where switching focus between panes costs you.
How it works
The raw OBV is normalized to a 0–1 range over a configurable lookback, then mapped onto a band that's anchored to a short 20-EMA of price and sized using ATR. The result is an OBV "wave" that hugs the candles and auto-adjusts to recent volatility, so it stays readable whether the instrument is quiet or trending hard.
Settings
Scaling & Position
Lookback Period — bars used to normalize OBV. Smaller is more reactive; ~100 for 5m, ~150 for 15m.
Anchor Position — place the OBV wave above, below, or centered on price.
Auto-Fit Height (ATR) — sizes the wave to recent volatility. Recommended ON for intraday.
Height Multiplier / Height % — controls wave amplitude (ATR mode vs. manual mode).
Offset Distance — how far the wave sits from the candles.
Smoothing
Optional moving average over OBV — SMA, EMA, SMMA (RMA), WMA, or VWMA.
SMA + Bollinger Bands adds volatility bands around the OBV MA to flag when volume flow is stretched.
How to read it
Watch the shape, not the absolute value (it's normalized). OBV rising while price stalls = accumulation building. OBV falling into a price high = bearish divergence, momentum may be hollow. The smoothing MA helps filter noise on lower timeframes.
Notes
Requires an instrument with real volume data — won't work on feeds that don't supply volume. Tuned for intraday but works on any timeframe. Open-source — feel free to learn from it or adapt it.
Скрипт с открытым кодом
В истинном духе TradingView, создатель этого скрипта сделал его открытым исходным кодом, чтобы трейдеры могли проверить и убедиться в его функциональности. Браво автору! Вы можете использовать его бесплатно, но помните, что перепубликация кода подчиняется нашим Правилам поведения.

Отказ от ответственности
Информация и публикации не предназначены для предоставления и не являются финансовыми, инвестиционными, торговыми или другими видами советов или рекомендаций, предоставленных или одобренных TradingView. Подробнее читайте в Условиях использования.
Скрипт с открытым кодом
В истинном духе TradingView, создатель этого скрипта сделал его открытым исходным кодом, чтобы трейдеры могли проверить и убедиться в его функциональности. Браво автору! Вы можете использовать его бесплатно, но помните, что перепубликация кода подчиняется нашим Правилам поведения.
Отказ от ответственности
Информация и публикации не предназначены для предоставления и не являются финансовыми, инвестиционными, торговыми или другими видами советов или рекомендаций, предоставленных или одобренных TradingView. Подробнее читайте в Условиях использования.