Heartland Previous-Day Pivot Levels
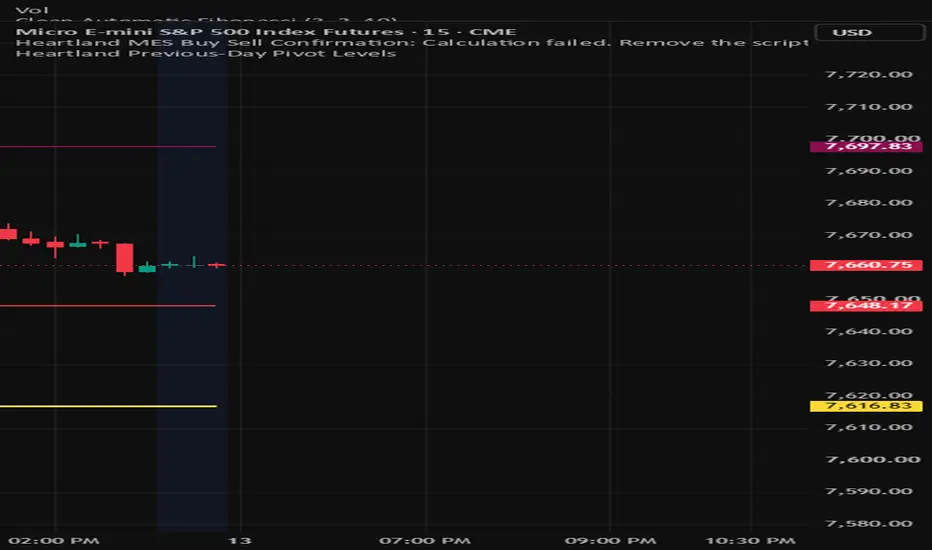
This indicator calculates traditional pivot levels using the previous completed trading day’s high, low and closing price. It displays the central equilibrium pivot, R1 and R2 resistance levels, and S1 and S2 support levels. The levels update automatically at the beginning of each new trading day and can help traders identify market direction, potential support and resistance, and possible profit targets. This indicator is intended for educational and market-analysis purposes only and should not be considered financial advice.

Отказ от ответственности
Информация и публикации не предназначены для предоставления и не являются финансовыми, инвестиционными, торговыми или другими видами советов или рекомендаций, предоставленных или одобренных TradingView. Подробнее читайте в Условиях использования.
Отказ от ответственности
Информация и публикации не предназначены для предоставления и не являются финансовыми, инвестиционными, торговыми или другими видами советов или рекомендаций, предоставленных или одобренных TradingView. Подробнее читайте в Условиях использования.