M-Alpha-Heatmap - Estimated Liquidation Zones
What it does
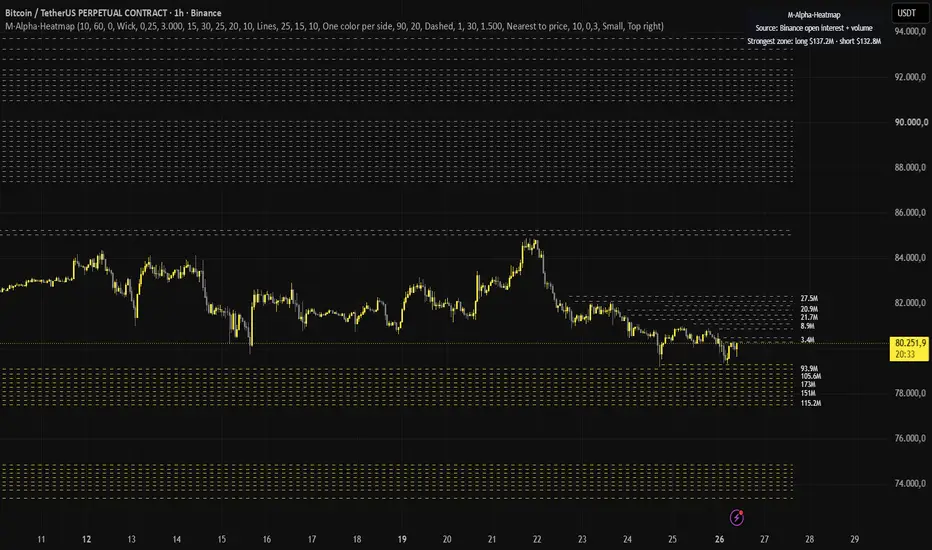
M·Alpha·Heatmap estimates where leveraged positions would be liquidated and draws these levels as zones on the chart: long liquidations below price (yellow), short liquidations above price (grey). The stronger a zone, the more estimated position size sits at that level. A zone disappears once price has reached it, because those positions would already be liquidated.
How it works
1. New positions: on every confirmed bar the script reads the change in Binance perpetual open interest for the base coin (symbol pattern BINANCE:<COIN>USDT.P_OI). Only rising open interest counts as newly opened positions. If no open interest data exists for the symbol, it falls back to a user-defined share of the bar's volume, and the legend says so.
2. Long/short split: on rising candles a configurable share (default 60 %) is treated as longs, on falling candles the reverse.
3. Leverage tiers: the new positions are spread over five tiers (5×, 10×, 25×, 50×, 100×) with adjustable weights. For each tier the liquidation price is estimated from the bar's typical price (hlc3) with a simple maintenance buffer: entry × (1 − 0.95 / leverage) for longs and entry × (1 + 0.95 / leverage) for shorts.
4. Zones: these amounts are accumulated into price buckets of a fixed percentage width on a logarithmic grid, so zones stay comparable across price levels.
5. Triggering: when a bar's wick (or close, selectable) reaches a zone, the zone is removed. An optional decay lets older zones fade.
6. Display: the strongest zones per side are drawn, plus the zones nearest to the current price, which always remain visible even when they are small compared with large old zones. Amount labels close to each other are merged into one label.
How to use it
- Works best on crypto perpetuals that have Binance open interest data (e.g. BTC, ETH, SOL), on intraday timeframes.
- Read the zones as areas where forced orders may cluster, not as buy or sell signals.
- Adjust the leverage weights and the long share to match the market you trade. "Always show nearest zones per side" keeps the levels around price readable.
- Display options: cloud, lines or both; one color per side or a cold-to-hot gradient.
What makes it different
- Uses the change in open interest (new positions only) instead of raw volume where data is available, and tells you in the legend which source is active.
- Zones are removed as soon as price reaches them, so the chart shows only levels that have not been hit yet.
- Nearest zones stay visible next to the strongest ones, and nearby labels are merged, which keeps the chart readable on long histories.
- Calculations run on confirmed bars only; nothing is drawn from future data.
Limitations
- These are estimates. Real liquidation levels depend on each trader's entry, margin mode, leverage and exchange rules, which are not public. The leverage weights and the long share are assumptions you can change.
- Open interest from one exchange (Binance) does not represent the whole market.
- Without open interest data, the volume fallback is a rough approximation.
- The script does not generate signals and makes no statement about future price movement. Use it as context together with your own analysis.
M·Alpha·Heatmap estimates where leveraged positions would be liquidated and draws these levels as zones on the chart: long liquidations below price (yellow), short liquidations above price (grey). The stronger a zone, the more estimated position size sits at that level. A zone disappears once price has reached it, because those positions would already be liquidated.
How it works
1. New positions: on every confirmed bar the script reads the change in Binance perpetual open interest for the base coin (symbol pattern BINANCE:<COIN>USDT.P_OI). Only rising open interest counts as newly opened positions. If no open interest data exists for the symbol, it falls back to a user-defined share of the bar's volume, and the legend says so.
2. Long/short split: on rising candles a configurable share (default 60 %) is treated as longs, on falling candles the reverse.
3. Leverage tiers: the new positions are spread over five tiers (5×, 10×, 25×, 50×, 100×) with adjustable weights. For each tier the liquidation price is estimated from the bar's typical price (hlc3) with a simple maintenance buffer: entry × (1 − 0.95 / leverage) for longs and entry × (1 + 0.95 / leverage) for shorts.
4. Zones: these amounts are accumulated into price buckets of a fixed percentage width on a logarithmic grid, so zones stay comparable across price levels.
5. Triggering: when a bar's wick (or close, selectable) reaches a zone, the zone is removed. An optional decay lets older zones fade.
6. Display: the strongest zones per side are drawn, plus the zones nearest to the current price, which always remain visible even when they are small compared with large old zones. Amount labels close to each other are merged into one label.
How to use it
- Works best on crypto perpetuals that have Binance open interest data (e.g. BTC, ETH, SOL), on intraday timeframes.
- Read the zones as areas where forced orders may cluster, not as buy or sell signals.
- Adjust the leverage weights and the long share to match the market you trade. "Always show nearest zones per side" keeps the levels around price readable.
- Display options: cloud, lines or both; one color per side or a cold-to-hot gradient.
What makes it different
- Uses the change in open interest (new positions only) instead of raw volume where data is available, and tells you in the legend which source is active.
- Zones are removed as soon as price reaches them, so the chart shows only levels that have not been hit yet.
- Nearest zones stay visible next to the strongest ones, and nearby labels are merged, which keeps the chart readable on long histories.
- Calculations run on confirmed bars only; nothing is drawn from future data.
Limitations
- These are estimates. Real liquidation levels depend on each trader's entry, margin mode, leverage and exchange rules, which are not public. The leverage weights and the long share are assumptions you can change.
- Open interest from one exchange (Binance) does not represent the whole market.
- Without open interest data, the volume fallback is a rough approximation.
- The script does not generate signals and makes no statement about future price movement. Use it as context together with your own analysis.

Tested on unseen data, honest weekly results, no promises. malphacore.com · Shop: t.me/MAlphaCoreShopBot?start=tv
Отказ от ответственности
Информация и публикации не предназначены для предоставления и не являются финансовыми, инвестиционными, торговыми или другими видами советов или рекомендаций, предоставленных или одобренных TradingView. Подробнее читайте в Условиях использования.
Tested on unseen data, honest weekly results, no promises. malphacore.com · Shop: t.me/MAlphaCoreShopBot?start=tv
Отказ от ответственности
Информация и публикации не предназначены для предоставления и не являются финансовыми, инвестиционными, торговыми или другими видами советов или рекомендаций, предоставленных или одобренных TradingView. Подробнее читайте в Условиях использования.