OPEN-SOURCE SCRIPT
Self Strength Oscillator
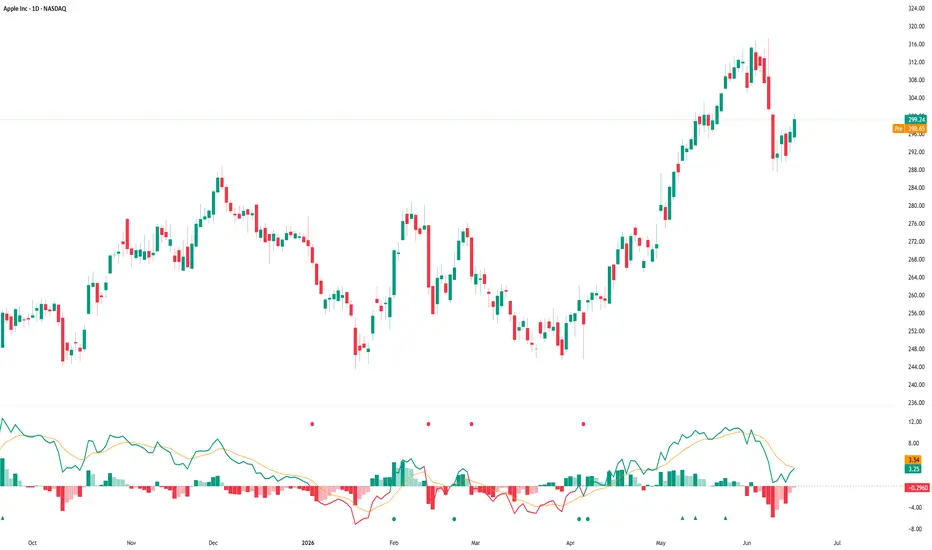
1. Overview
Self Strength Oscillator is an internal strength indicator that measures how strong price is compared with its own long-term trend baseline.
The indicator is designed to help traders evaluate whether price is showing internal strength or internal weakness relative to a selected moving-average baseline.
This is an indicator, not a strategy. It does not place trades, does not execute orders, and does not produce TradingView Strategy Tester results.
2. Core Idea
The indicator is built around a zero line.
When the oscillator is above zero, price is trading above its own trend baseline.
When the oscillator is below zero, price is trading below its own trend baseline.
This makes the tool useful for identifying whether the symbol is showing internal strength or weakness.
3. Trend Baseline
The trend baseline is the reference line used to measure internal strength.
Users can choose the baseline type:
* EMA
* SMA
* WMA
The default baseline length is 50.
A longer baseline gives a slower and broader strength reading.
A shorter baseline gives a faster and more reactive reading.
4. Normalization Modes
The indicator includes two normalization modes:
Percent
This mode measures the percentage distance between price and its trend baseline.
Volatility (ATR)
This mode normalizes the distance using ATR percentage.
ATR normalization can help adjust readings for volatility differences across symbols and timeframes.
5. Oscillator Reading
The oscillator line represents the distance between price and the selected trend baseline.
Above zero
Price is above its own baseline. This can suggest internal strength.
Below zero
Price is below its own baseline. This can suggest internal weakness.
The oscillator should be interpreted as a strength filter, not as a direct trade signal.
6. Signal Line
The indicator includes an optional signal line.
The signal line is a moving average of the oscillator.
It helps users observe whether internal strength momentum is improving or weakening.
When the oscillator is above the signal line, internal strength may be improving.
When the oscillator is below the signal line, internal strength may be fading.
This should be used as context only, not as a standalone entry or exit signal.
7. Histogram
The histogram shows the difference between the oscillator and the signal line.
The histogram is ON by default.
A rising histogram can indicate improving internal strength momentum.
A falling histogram can indicate fading internal strength momentum.
The histogram can help users observe changes in strength momentum before or during price movement.
8. New Strength Highs
The indicator can flag new strength highs.
This feature is ON by default.
A New Strength High appears when the oscillator prints a new high over the selected lookback window while still above zero.
This can help highlight moments where internal strength is improving.
A New Strength High is not a guaranteed breakout signal. It is only a visual alert that the oscillator has reached a new strength high.
9. Zero-Line Crosses
The indicator can flag zero-line crosses.
This feature is ON by default.
A cross above zero means price moved from below its baseline to above its baseline.
A cross below zero means price moved from above its baseline to below its baseline.
Zero-line crosses can help identify changes in internal strength state.
They are not automatic buy or sell signals.
10. Background Regime
The indicator includes an optional background regime color.
The background is OFF by default to keep the pane clean.
When enabled, it can tint the pane based on whether the oscillator is above or below zero.
Users can enable this feature if they prefer a stronger visual regime view.
11. How to Use
A practical workflow:
1. Add the indicator to the chart.
2. Watch the oscillator relative to the zero line.
3. Above zero suggests internal strength.
4. Below zero suggests internal weakness.
5. Use the signal line to observe strength momentum.
6. Use the histogram to track acceleration or fading of internal strength.
7. Use New Strength High markers as alerts that internal strength is improving.
8. Use Zero-Line Cross markers as alerts that price has changed its internal strength state.
9. Combine the indicator with trend, support/resistance, market structure, volume, and risk management.
10. Do not use any single marker as a complete trading decision.
11. Suggested Use Cases
Self Strength Oscillator can be useful for:
* Internal strength analysis
* Trend confirmation
* Momentum confirmation
* Pullback review
* Breakout preparation
* Watchlist review
* Comparing price against its own baseline
* Filtering weak setups
* Identifying improving internal strength
* Monitoring fading strength
13. Important Usage Note
This indicator does not tell users when to buy or sell.
It does not predict future price movement.
It does not guarantee a breakout.
It does not guarantee continuation.
It does not guarantee reversal.
It only helps users observe whether price is strong or weak relative to its own trend baseline.
The best use is as a confirmation and filtering tool, not as a standalone trading system.
14. Limitations
The oscillator can remain above zero for a long time during strong trends.
The oscillator can remain below zero for a long time during weak trends.
Zero-line crosses can happen frequently during sideways markets.
New Strength High markers can appear after price has already moved.
A positive oscillator does not guarantee that price will continue higher.
A negative oscillator does not guarantee that price will continue lower.
Users should always analyze the broader chart context before making any trading decision.
15. Alerts
The script includes alert conditions for:
* SSO crossing above zero
* SSO crossing below zero
* SSO printing a new strength high
Alerts are notifications only. They do not place orders and do not confirm broker execution.
16. Originality and Purpose
Self Strength Oscillator combines internal strength calculation with a signal line, histogram, zero-line state, and new strength high alerts.
The purpose is to provide a clean internal strength oscillator that helps traders evaluate whether price is showing strength or weakness compared with its own trend baseline.
17. Educational Disclaimer
This script is for educational and chart-analysis purposes only. It is not financial advice, investment advice, or a recommendation to buy or sell any financial instrument. Users are responsible for their own analysis, risk management, and trading decisions.
Self Strength Oscillator is an internal strength indicator that measures how strong price is compared with its own long-term trend baseline.
The indicator is designed to help traders evaluate whether price is showing internal strength or internal weakness relative to a selected moving-average baseline.
This is an indicator, not a strategy. It does not place trades, does not execute orders, and does not produce TradingView Strategy Tester results.
2. Core Idea
The indicator is built around a zero line.
When the oscillator is above zero, price is trading above its own trend baseline.
When the oscillator is below zero, price is trading below its own trend baseline.
This makes the tool useful for identifying whether the symbol is showing internal strength or weakness.
3. Trend Baseline
The trend baseline is the reference line used to measure internal strength.
Users can choose the baseline type:
* EMA
* SMA
* WMA
The default baseline length is 50.
A longer baseline gives a slower and broader strength reading.
A shorter baseline gives a faster and more reactive reading.
4. Normalization Modes
The indicator includes two normalization modes:
Percent
This mode measures the percentage distance between price and its trend baseline.
Volatility (ATR)
This mode normalizes the distance using ATR percentage.
ATR normalization can help adjust readings for volatility differences across symbols and timeframes.
5. Oscillator Reading
The oscillator line represents the distance between price and the selected trend baseline.
Above zero
Price is above its own baseline. This can suggest internal strength.
Below zero
Price is below its own baseline. This can suggest internal weakness.
The oscillator should be interpreted as a strength filter, not as a direct trade signal.
6. Signal Line
The indicator includes an optional signal line.
The signal line is a moving average of the oscillator.
It helps users observe whether internal strength momentum is improving or weakening.
When the oscillator is above the signal line, internal strength may be improving.
When the oscillator is below the signal line, internal strength may be fading.
This should be used as context only, not as a standalone entry or exit signal.
7. Histogram
The histogram shows the difference between the oscillator and the signal line.
The histogram is ON by default.
A rising histogram can indicate improving internal strength momentum.
A falling histogram can indicate fading internal strength momentum.
The histogram can help users observe changes in strength momentum before or during price movement.
8. New Strength Highs
The indicator can flag new strength highs.
This feature is ON by default.
A New Strength High appears when the oscillator prints a new high over the selected lookback window while still above zero.
This can help highlight moments where internal strength is improving.
A New Strength High is not a guaranteed breakout signal. It is only a visual alert that the oscillator has reached a new strength high.
9. Zero-Line Crosses
The indicator can flag zero-line crosses.
This feature is ON by default.
A cross above zero means price moved from below its baseline to above its baseline.
A cross below zero means price moved from above its baseline to below its baseline.
Zero-line crosses can help identify changes in internal strength state.
They are not automatic buy or sell signals.
10. Background Regime
The indicator includes an optional background regime color.
The background is OFF by default to keep the pane clean.
When enabled, it can tint the pane based on whether the oscillator is above or below zero.
Users can enable this feature if they prefer a stronger visual regime view.
11. How to Use
A practical workflow:
1. Add the indicator to the chart.
2. Watch the oscillator relative to the zero line.
3. Above zero suggests internal strength.
4. Below zero suggests internal weakness.
5. Use the signal line to observe strength momentum.
6. Use the histogram to track acceleration or fading of internal strength.
7. Use New Strength High markers as alerts that internal strength is improving.
8. Use Zero-Line Cross markers as alerts that price has changed its internal strength state.
9. Combine the indicator with trend, support/resistance, market structure, volume, and risk management.
10. Do not use any single marker as a complete trading decision.
11. Suggested Use Cases
Self Strength Oscillator can be useful for:
* Internal strength analysis
* Trend confirmation
* Momentum confirmation
* Pullback review
* Breakout preparation
* Watchlist review
* Comparing price against its own baseline
* Filtering weak setups
* Identifying improving internal strength
* Monitoring fading strength
13. Important Usage Note
This indicator does not tell users when to buy or sell.
It does not predict future price movement.
It does not guarantee a breakout.
It does not guarantee continuation.
It does not guarantee reversal.
It only helps users observe whether price is strong or weak relative to its own trend baseline.
The best use is as a confirmation and filtering tool, not as a standalone trading system.
14. Limitations
The oscillator can remain above zero for a long time during strong trends.
The oscillator can remain below zero for a long time during weak trends.
Zero-line crosses can happen frequently during sideways markets.
New Strength High markers can appear after price has already moved.
A positive oscillator does not guarantee that price will continue higher.
A negative oscillator does not guarantee that price will continue lower.
Users should always analyze the broader chart context before making any trading decision.
15. Alerts
The script includes alert conditions for:
* SSO crossing above zero
* SSO crossing below zero
* SSO printing a new strength high
Alerts are notifications only. They do not place orders and do not confirm broker execution.
16. Originality and Purpose
Self Strength Oscillator combines internal strength calculation with a signal line, histogram, zero-line state, and new strength high alerts.
The purpose is to provide a clean internal strength oscillator that helps traders evaluate whether price is showing strength or weakness compared with its own trend baseline.
17. Educational Disclaimer
This script is for educational and chart-analysis purposes only. It is not financial advice, investment advice, or a recommendation to buy or sell any financial instrument. Users are responsible for their own analysis, risk management, and trading decisions.
Скрипт с открытым кодом
В истинном духе TradingView, создатель этого скрипта сделал его открытым исходным кодом, чтобы трейдеры могли проверить и убедиться в его функциональности. Браво автору! Вы можете использовать его бесплатно, но помните, что перепубликация кода подчиняется нашим Правилам поведения.

Отказ от ответственности
Информация и публикации не предназначены для предоставления и не являются финансовыми, инвестиционными, торговыми или другими видами советов или рекомендаций, предоставленных или одобренных TradingView. Подробнее читайте в Условиях использования.
Скрипт с открытым кодом
В истинном духе TradingView, создатель этого скрипта сделал его открытым исходным кодом, чтобы трейдеры могли проверить и убедиться в его функциональности. Браво автору! Вы можете использовать его бесплатно, но помните, что перепубликация кода подчиняется нашим Правилам поведения.
Отказ от ответственности
Информация и публикации не предназначены для предоставления и не являются финансовыми, инвестиционными, торговыми или другими видами советов или рекомендаций, предоставленных или одобренных TradingView. Подробнее читайте в Условиях использования.