OPEN-SOURCE SCRIPT
Adaptive Pivot Structure [WillyAlgoTrader]
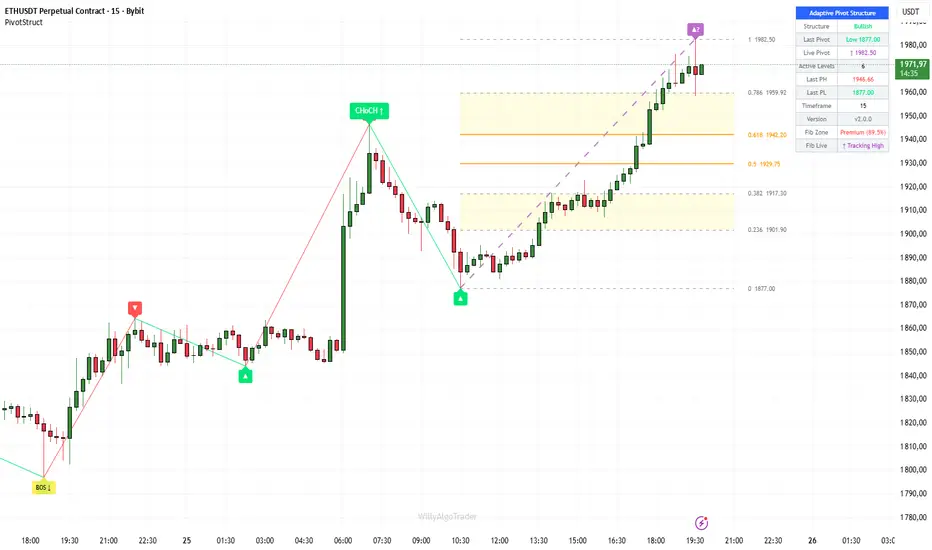
Adaptive Pivot Structure (APS) is an overlay indicator that maps market structure in real time by detecting swing pivots, classifying structural breaks (BOS / CHoCH), tracking missed reversal levels, and projecting a dynamic Fibonacci grid between the last confirmed pivot and the live forming extreme.
Most pivot-based tools plot swing points with a fixed delay and leave the trader to interpret structure manually. APS automates the full workflow: it detects pivots, grades their strength against ATR, identifies whether the structure is continuing (BOS) or reversing (CHoCH), keeps track of levels that price skipped over, and stretches a Fibonacci retracement grid that updates bar-by-bar as the current swing extends — giving you an always-current picture of where price sits within the swing.
🔍 WHAT MAKES IT ORIGINAL
APS combines five analytical layers into a single coherent overlay that would otherwise require multiple separate indicators:
1. ATR-graded pivot detection. Every swing high and low is measured against the current ATR to classify it as Strong (swing > 1.5× ATR) or Weak. You can filter the display to show only strong pivots, only weak ones, or all — allowing you to strip noise on lower timeframes while keeping full detail on higher ones.
2. Automated BOS / CHoCH classification. The indicator continuously compares each new pivot high to the previous pivot high, and each new pivot low to the previous pivot low. When a higher high forms in an existing uptrend, the script labels it as a Break of Structure (BOS ↑) — trend continuation. When a higher high forms after a downtrend, it labels a Change of Character (CHoCH ↑) — potential reversal. The same logic applies in reverse for bearish breaks. This removes the subjectivity of manually drawing and labeling structure shifts.
3. Missed reversal tracking. When two consecutive pivots form on the same side (e.g. two pivot highs without an intervening pivot low), the "missed" pivot low between them is flagged with a ◇ marker and extended as a dotted horizontal level until price breaks it. These missed levels often act as hidden support/resistance that conventional pivot tools ignore entirely.
4. Live (potential) pivot tracking. Instead of waiting for full confirmation (which inherently lags by N bars), APS tracks the running extreme since the last confirmed pivot and plots it in real time as a "potential next pivot" with a dashed zigzag extension. This gives you immediate visual feedback on how far the current swing has traveled and where the Fibonacci grid is anchored — without pretending the pivot is confirmed.
5. Dynamic Fibonacci grid. A full Fibonacci retracement (0, 0.236, 0.382, 0.5, 0.618, 0.786, 1.0 — with optional 1.272 and 1.618 extensions) is drawn between the last confirmed pivot and the live pivot. The grid redraws every bar as the live extreme moves, so the retracement levels always reflect the current swing range. The OTE (Optimal Trade Entry) zones at 0.236–0.382 and 0.618–0.786 are highlighted with a fill to make them easy to spot at a glance.
⚙️ HOW IT WORKS
Pivot detection:
Pivots are identified using ta.pivothigh() and ta.pivotlow() with a user-defined lookback (Pivot Length). A pivot high is confirmed when the bar has N lower highs on both sides; a pivot low when the bar has N higher lows on both sides. This means confirmed pivots appear with a delay of N bars — this is inherent to the standard pivot detection algorithm.
Strength grading:
Once a pivot is detected, the script measures the absolute price distance from the previous pivot to the current one. If this distance exceeds 1.5× the current ATR value, the pivot is classified as "Strong"; otherwise "Weak." A minimum swing size filter (Min Swing Size, expressed as an ATR multiple) lets you suppress insignificant swings entirely.
Structure logic:
The indicator maintains a running structure direction variable. When a new pivot high exceeds the previous pivot high and the current structure is already bullish, it triggers a BOS ↑. If the structure was bearish, it triggers a CHoCH ↑ (reversal). Mirror logic applies for lows. This follows standard Smart Money Concepts methodology.
Missed pivot logic:
Between any two consecutive same-side pivots, the indicator records the highest high or lowest low that occurred in the gap. This "missed" extreme is marked and extended as a horizontal level. The level is automatically removed from the chart when price closes through it — keeping only active levels visible.
Live pivot:
After each confirmed pivot, the script starts tracking the running high (if expecting a pivot high next) or running low (if expecting a pivot low). This value updates every bar and serves as one anchor of the Fibonacci grid. A "▲?" or "▼?" label and a dashed line show where this potential pivot currently sits.
Fibonacci grid:
The retracement is calculated between the lower and upper anchor of the current swing (using the confirmed pivot on one side and the live extreme on the other). All seven standard ratios are drawn as horizontal lines from the earlier pivot's bar index to 5 bars into the future. The 0.5 and 0.618 levels are drawn thicker and in a highlight color for emphasis.
⚠️ REPAINTING BEHAVIOR — IMPORTANT
This indicator is designed as a live analysis tool, not a backtesting signal generator. The following elements will change on the current bar:
— The Live Pivot marker moves as the running extreme updates
— The Fibonacci grid redraws as the live anchor moves
— BOS/CHoCH labels based on pivots inherit the standard pivot detection delay
Confirmed pivots themselves do not repaint — once a bar is no longer within the pivot lookback window, its pivot status is final. The alert system includes a "Confirmed Only" toggle (on by default) that restricts alerts to bar-close events, ensuring no repainting alerts reach your trading bot.
📖 HOW TO USE
Reading the chart:
— ▲ / ▽ labels at swing lows = confirmed pivot lows (filled = Strong, outline = Weak)
— ▼ / △ labels at swing highs = confirmed pivot highs (filled = Strong, outline = Weak)
— ◇ markers = missed reversals (cyan for missed lows, orange for missed highs)
— Dotted horizontal lines from ◇ markers = active missed levels (auto-removed when broken)
— "BOS ↑/↓" yellow labels = Break of Structure (trend continuation)
— "CHoCH ↑/↓" green/red labels = Change of Character (potential reversal)
— Purple dashed line with "▲?" or "▼?" = live potential pivot (updates every bar)
— Fibonacci lines with OTE zone fills = dynamic retracement grid
Suggested workflow:
— Use CHoCH labels as early warning of trend reversals — then look for entries in the Fibonacci discount/premium zones
— Use BOS labels to confirm trend continuation — look for pullback entries at 0.618–0.786 retracement
— Watch the dashboard's "Fib Zone" readout: Discount (below 38.2%) favors buys, Premium (above 61.8%) favors sells, Equilibrium suggests waiting
— Missed reversal levels act as hidden S/R — watch for reactions when price revisits them
Timeframe guidance:
— Scalping (1–5min): Pivot Length 3–5, Min Swing 0.5 ATR, Strong Only filter
— Intraday (15min–1H): Pivot Length 5–10, default settings
— Swing (4H–Daily): Pivot Length 10–20, show all strengths for full context
⚙️ KEY SETTINGS REFERENCE
— Pivot Length (default 5): bars left/right for pivot detection — lower = faster but noisier
— ATR Length (default 14): period for strength grading and minimum swing filter
— Min Swing Size (default 0.0): minimum swing as ATR multiple — increase to filter small moves
— Pivot Strength Filter (default All): show All / Strong Only / Weak Only
— Max Active Levels (default 10): maximum missed-reversal horizontal lines displayed
— Show Live Pivot (default On): toggle the real-time potential pivot tracker
— Show Fibonacci Grid (default On): toggle the dynamic retracement overlay
— Show Extensions (default Off): add 1.272 and 1.618 extension levels
— Show Fib Zone Fill (default On): highlight OTE zones (0.236–0.382 and 0.618–0.786)
— Alerts: Confirmed Only (default On): restrict alerts to bar-close confirmation — recommended for bots
📊 Dashboard
The info panel (adjustable to any chart corner) displays:
— Current market structure (Bullish / Bearish / Ranging)
— Last confirmed pivot type and price
— Live pivot direction and price
— Number of active missed-reversal levels
— Last PH and PL values
— Fib Zone classification (Premium / Discount / Equilibrium) with percentage
— Current timeframe and indicator version
⚠️ DISCLAIMER
— This tool is intended for live chart analysis and structure mapping — it is not a standalone entry/exit signal system.
— The live pivot and Fibonacci grid are designed to repaint by nature — they track the forming swing in real time. Do not use them for backtesting.
— Past pivot patterns and structure shifts do not guarantee future price behavior.
— Always combine structural analysis with proper risk management and additional confluence.
Most pivot-based tools plot swing points with a fixed delay and leave the trader to interpret structure manually. APS automates the full workflow: it detects pivots, grades their strength against ATR, identifies whether the structure is continuing (BOS) or reversing (CHoCH), keeps track of levels that price skipped over, and stretches a Fibonacci retracement grid that updates bar-by-bar as the current swing extends — giving you an always-current picture of where price sits within the swing.
🔍 WHAT MAKES IT ORIGINAL
APS combines five analytical layers into a single coherent overlay that would otherwise require multiple separate indicators:
1. ATR-graded pivot detection. Every swing high and low is measured against the current ATR to classify it as Strong (swing > 1.5× ATR) or Weak. You can filter the display to show only strong pivots, only weak ones, or all — allowing you to strip noise on lower timeframes while keeping full detail on higher ones.
2. Automated BOS / CHoCH classification. The indicator continuously compares each new pivot high to the previous pivot high, and each new pivot low to the previous pivot low. When a higher high forms in an existing uptrend, the script labels it as a Break of Structure (BOS ↑) — trend continuation. When a higher high forms after a downtrend, it labels a Change of Character (CHoCH ↑) — potential reversal. The same logic applies in reverse for bearish breaks. This removes the subjectivity of manually drawing and labeling structure shifts.
3. Missed reversal tracking. When two consecutive pivots form on the same side (e.g. two pivot highs without an intervening pivot low), the "missed" pivot low between them is flagged with a ◇ marker and extended as a dotted horizontal level until price breaks it. These missed levels often act as hidden support/resistance that conventional pivot tools ignore entirely.
4. Live (potential) pivot tracking. Instead of waiting for full confirmation (which inherently lags by N bars), APS tracks the running extreme since the last confirmed pivot and plots it in real time as a "potential next pivot" with a dashed zigzag extension. This gives you immediate visual feedback on how far the current swing has traveled and where the Fibonacci grid is anchored — without pretending the pivot is confirmed.
5. Dynamic Fibonacci grid. A full Fibonacci retracement (0, 0.236, 0.382, 0.5, 0.618, 0.786, 1.0 — with optional 1.272 and 1.618 extensions) is drawn between the last confirmed pivot and the live pivot. The grid redraws every bar as the live extreme moves, so the retracement levels always reflect the current swing range. The OTE (Optimal Trade Entry) zones at 0.236–0.382 and 0.618–0.786 are highlighted with a fill to make them easy to spot at a glance.
⚙️ HOW IT WORKS
Pivot detection:
Pivots are identified using ta.pivothigh() and ta.pivotlow() with a user-defined lookback (Pivot Length). A pivot high is confirmed when the bar has N lower highs on both sides; a pivot low when the bar has N higher lows on both sides. This means confirmed pivots appear with a delay of N bars — this is inherent to the standard pivot detection algorithm.
Strength grading:
Once a pivot is detected, the script measures the absolute price distance from the previous pivot to the current one. If this distance exceeds 1.5× the current ATR value, the pivot is classified as "Strong"; otherwise "Weak." A minimum swing size filter (Min Swing Size, expressed as an ATR multiple) lets you suppress insignificant swings entirely.
Structure logic:
The indicator maintains a running structure direction variable. When a new pivot high exceeds the previous pivot high and the current structure is already bullish, it triggers a BOS ↑. If the structure was bearish, it triggers a CHoCH ↑ (reversal). Mirror logic applies for lows. This follows standard Smart Money Concepts methodology.
Missed pivot logic:
Between any two consecutive same-side pivots, the indicator records the highest high or lowest low that occurred in the gap. This "missed" extreme is marked and extended as a horizontal level. The level is automatically removed from the chart when price closes through it — keeping only active levels visible.
Live pivot:
After each confirmed pivot, the script starts tracking the running high (if expecting a pivot high next) or running low (if expecting a pivot low). This value updates every bar and serves as one anchor of the Fibonacci grid. A "▲?" or "▼?" label and a dashed line show where this potential pivot currently sits.
Fibonacci grid:
The retracement is calculated between the lower and upper anchor of the current swing (using the confirmed pivot on one side and the live extreme on the other). All seven standard ratios are drawn as horizontal lines from the earlier pivot's bar index to 5 bars into the future. The 0.5 and 0.618 levels are drawn thicker and in a highlight color for emphasis.
⚠️ REPAINTING BEHAVIOR — IMPORTANT
This indicator is designed as a live analysis tool, not a backtesting signal generator. The following elements will change on the current bar:
— The Live Pivot marker moves as the running extreme updates
— The Fibonacci grid redraws as the live anchor moves
— BOS/CHoCH labels based on pivots inherit the standard pivot detection delay
Confirmed pivots themselves do not repaint — once a bar is no longer within the pivot lookback window, its pivot status is final. The alert system includes a "Confirmed Only" toggle (on by default) that restricts alerts to bar-close events, ensuring no repainting alerts reach your trading bot.
📖 HOW TO USE
Reading the chart:
— ▲ / ▽ labels at swing lows = confirmed pivot lows (filled = Strong, outline = Weak)
— ▼ / △ labels at swing highs = confirmed pivot highs (filled = Strong, outline = Weak)
— ◇ markers = missed reversals (cyan for missed lows, orange for missed highs)
— Dotted horizontal lines from ◇ markers = active missed levels (auto-removed when broken)
— "BOS ↑/↓" yellow labels = Break of Structure (trend continuation)
— "CHoCH ↑/↓" green/red labels = Change of Character (potential reversal)
— Purple dashed line with "▲?" or "▼?" = live potential pivot (updates every bar)
— Fibonacci lines with OTE zone fills = dynamic retracement grid
Suggested workflow:
— Use CHoCH labels as early warning of trend reversals — then look for entries in the Fibonacci discount/premium zones
— Use BOS labels to confirm trend continuation — look for pullback entries at 0.618–0.786 retracement
— Watch the dashboard's "Fib Zone" readout: Discount (below 38.2%) favors buys, Premium (above 61.8%) favors sells, Equilibrium suggests waiting
— Missed reversal levels act as hidden S/R — watch for reactions when price revisits them
Timeframe guidance:
— Scalping (1–5min): Pivot Length 3–5, Min Swing 0.5 ATR, Strong Only filter
— Intraday (15min–1H): Pivot Length 5–10, default settings
— Swing (4H–Daily): Pivot Length 10–20, show all strengths for full context
⚙️ KEY SETTINGS REFERENCE
— Pivot Length (default 5): bars left/right for pivot detection — lower = faster but noisier
— ATR Length (default 14): period for strength grading and minimum swing filter
— Min Swing Size (default 0.0): minimum swing as ATR multiple — increase to filter small moves
— Pivot Strength Filter (default All): show All / Strong Only / Weak Only
— Max Active Levels (default 10): maximum missed-reversal horizontal lines displayed
— Show Live Pivot (default On): toggle the real-time potential pivot tracker
— Show Fibonacci Grid (default On): toggle the dynamic retracement overlay
— Show Extensions (default Off): add 1.272 and 1.618 extension levels
— Show Fib Zone Fill (default On): highlight OTE zones (0.236–0.382 and 0.618–0.786)
— Alerts: Confirmed Only (default On): restrict alerts to bar-close confirmation — recommended for bots
📊 Dashboard
The info panel (adjustable to any chart corner) displays:
— Current market structure (Bullish / Bearish / Ranging)
— Last confirmed pivot type and price
— Live pivot direction and price
— Number of active missed-reversal levels
— Last PH and PL values
— Fib Zone classification (Premium / Discount / Equilibrium) with percentage
— Current timeframe and indicator version
⚠️ DISCLAIMER
— This tool is intended for live chart analysis and structure mapping — it is not a standalone entry/exit signal system.
— The live pivot and Fibonacci grid are designed to repaint by nature — they track the forming swing in real time. Do not use them for backtesting.
— Past pivot patterns and structure shifts do not guarantee future price behavior.
— Always combine structural analysis with proper risk management and additional confluence.
Скрипт с открытым кодом
В истинном духе TradingView, создатель этого скрипта сделал его открытым исходным кодом, чтобы трейдеры могли проверить и убедиться в его функциональности. Браво автору! Вы можете использовать его бесплатно, но помните, что перепубликация кода подчиняется нашим Правилам поведения.

10 years in trading. For all inquiries, contact me on my Telegram channel: t.me/WillyAlgoTrader or Instagram: @willytraderbtc
Отказ от ответственности
Информация и публикации не предназначены для предоставления и не являются финансовыми, инвестиционными, торговыми или другими видами советов или рекомендаций, предоставленных или одобренных TradingView. Подробнее читайте в Условиях использования.
Скрипт с открытым кодом
В истинном духе TradingView, создатель этого скрипта сделал его открытым исходным кодом, чтобы трейдеры могли проверить и убедиться в его функциональности. Браво автору! Вы можете использовать его бесплатно, но помните, что перепубликация кода подчиняется нашим Правилам поведения.
10 years in trading. For all inquiries, contact me on my Telegram channel: t.me/WillyAlgoTrader or Instagram: @willytraderbtc
Отказ от ответственности
Информация и публикации не предназначены для предоставления и не являются финансовыми, инвестиционными, торговыми или другими видами советов или рекомендаций, предоставленных или одобренных TradingView. Подробнее читайте в Условиях использования.