Обновлено
GBR MTF Adaptive Channel [Ghost Lines]
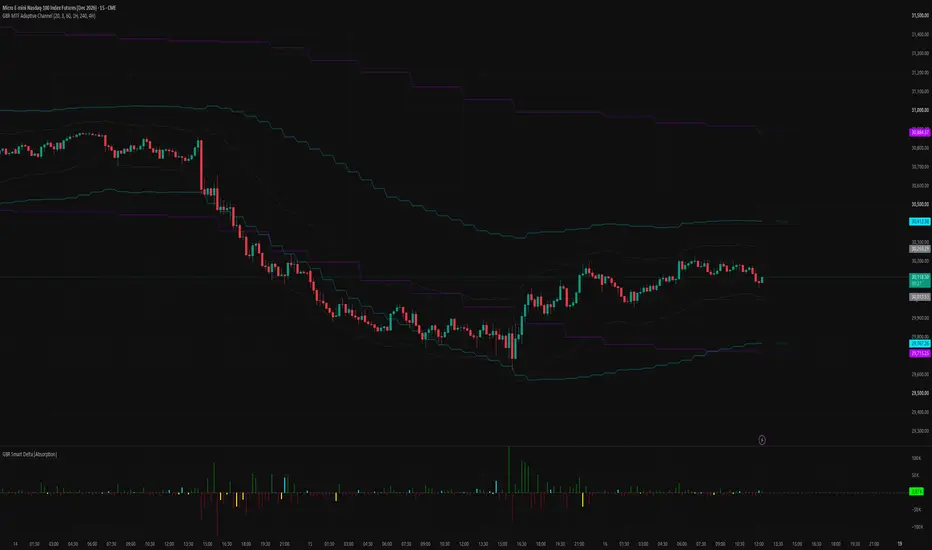
The GBR MTF Adaptive Channel solves the biggest problem day traders face: tunnel vision. When you are hyper-focused on the 1m or 5m chart, it is easy to miss that you are driving straight into a massive 4H resistance wall.
This indicator projects Higher Timeframe (HTF) volatility channels directly onto your execution chart without any of the visual clutter.
🔥 Core Features:
Triple Threat (MTF): Simultaneously plots the adaptive ATR/Keltner channel for your current timeframe, a Medium HTF (e.g., 1H), and a Macro HTF (e.g., 4H).
Ghost Lines: No distracting fills or blinding colors. The higher timeframe channels are rendered at 75% transparency using sleek Cyan and Purple, acting as silent guardrails in the background.
Dynamic Floating Labels: You never have to guess which line is which. Clean text labels float gracefully on the right side of the chart, clearly identifying the exact timeframe and level (e.g., "4H Resistance").
Institutional Adaptability: The default ATR multiplier is set wider (3.0) to filter out market noise and only highlight true structural extremes. Fully customizable in the settings.
🎯 How to use:
Keep this running in the background while using your primary execution setups. Use the Macro (Purple) and Medium (Cyan) outer bands as absolute hard stops or ultimate take-profit targets.
This indicator projects Higher Timeframe (HTF) volatility channels directly onto your execution chart without any of the visual clutter.
🔥 Core Features:
Triple Threat (MTF): Simultaneously plots the adaptive ATR/Keltner channel for your current timeframe, a Medium HTF (e.g., 1H), and a Macro HTF (e.g., 4H).
Ghost Lines: No distracting fills or blinding colors. The higher timeframe channels are rendered at 75% transparency using sleek Cyan and Purple, acting as silent guardrails in the background.
Dynamic Floating Labels: You never have to guess which line is which. Clean text labels float gracefully on the right side of the chart, clearly identifying the exact timeframe and level (e.g., "4H Resistance").
Institutional Adaptability: The default ATR multiplier is set wider (3.0) to filter out market noise and only highlight true structural extremes. Fully customizable in the settings.
🎯 How to use:
Keep this running in the background while using your primary execution setups. Use the Macro (Purple) and Medium (Cyan) outer bands as absolute hard stops or ultimate take-profit targets.
Информация о релизе
v2.0 — The bands are a volatility range, not support and resistanceTwo changes that matter, and one that fixes a misleading name.
1. The labels no longer say "Resistance" and "Support"
These bands are an ATR range around a moving average. They show how far
price has typically travelled from the average on that timeframe — and
they move with every bar, which is precisely what a level does not do.
Calling them support and resistance invited you to treat them as fixed
prices, which they are not. They are now simply "upper" and "lower".
What the channel is good for has not changed: seeing, from a low
timeframe, how much room there is before you run into the range of a
higher one.
2. New option: "Use only closed higher-timeframe bars", on by default
Previously the higher-timeframe channels updated while their bar was
still forming, so the lines moved continuously and the historical chart
looked tidier than it actually was. With the new option on, a channel
only updates once its bar has closed. On a low timeframe the higher
bands will now step rather than glide — that is the correct behaviour:
a 1-hour channel updates hourly, not every minute. Turn it off if you
prefer the live version, knowing what that means for the history.
3. Warning when a selected timeframe is lower than the chart
If you set 1H and 4H and then look at a daily chart, the script was
quietly reaching down instead of up, which produces values that look
plausible and are not. It now says so on the chart.
Other changes:
- Alerts when price reaches a higher-timeframe band
- Labels spread apart when two bands sit close together, instead of
printing on top of each other
- The chart-timeframe channel and the labels can be switched off
- Colours are configurable
- Interface in English throughout
Информация о релизе
v2.0a — Fix: chart timeframe channelThe channel for the chart's own timeframe was not drawing. The
conditional in the plot call was not resolving as intended; it now uses
the display parameter instead. If you had the chart channel switched on
and saw only the two higher-timeframe bands, this is why.
No other behaviour has changed.

Отказ от ответственности
Информация и публикации не предназначены для предоставления и не являются финансовыми, инвестиционными, торговыми или другими видами советов или рекомендаций, предоставленных или одобренных TradingView. Подробнее читайте в Условиях использования.
Отказ от ответственности
Информация и публикации не предназначены для предоставления и не являются финансовыми, инвестиционными, торговыми или другими видами советов или рекомендаций, предоставленных или одобренных TradingView. Подробнее читайте в Условиях использования.