OPEN-SOURCE SCRIPT
CLBS Reaction Zones
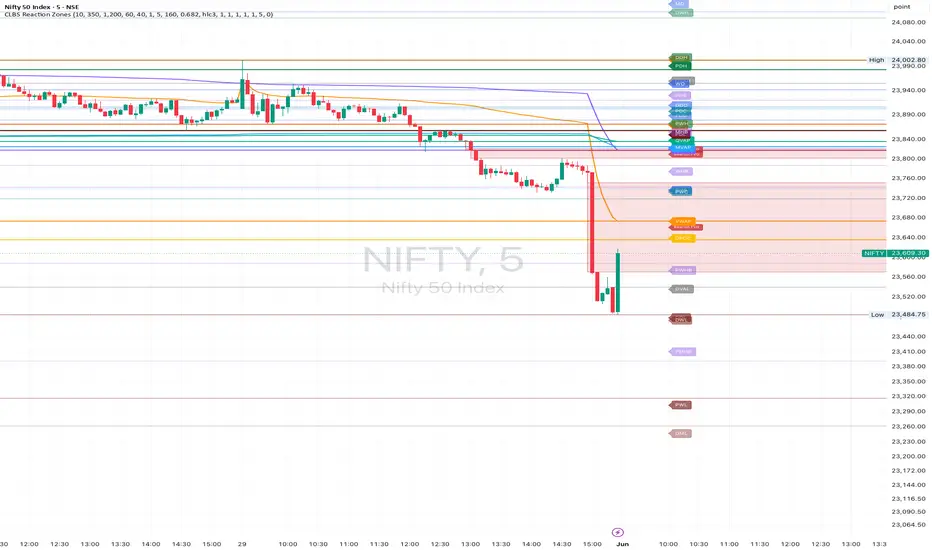
CLBS Reaction Zones is an educational market-structure indicator designed to map important reaction areas on the chart.
CLBS stands for Context, Levels, Behavior and Strategy.
This script combines multiple market reference concepts into one structured visual map. The purpose is not to generate buy or sell signals, but to help traders observe where price may react, accept, reject, rotate or expand.
Main components:
• Developing day levels
• Previous day levels
• Developing week levels
• Previous week levels
• Developing month levels
• Previous month levels
• Initial Balance High and Initial Balance Low
• Initial Balance range projection
• Developing day Point of Control, Value Area High and Value Area Low
• Daily, Weekly, Monthly, Quarterly and Yearly VWAP
• Optional VWAP bands
• Fair Value Gap zones using three-candle imbalance logic
VWAP logic:
The VWAP hierarchy uses anchored VWAP calculations for different periods. Daily VWAP resets at the start of each new day. Weekly VWAP resets at the start of each new week. Monthly VWAP resets at the start of each new month. Quarterly VWAP resets every three months. Yearly VWAP resets at the start of each new year.
VWAP is calculated using cumulative price multiplied by volume divided by cumulative volume for the selected period.
Value area logic:
The developing day value area uses a simple volume distribution model. Price is divided into buckets, volume is accumulated inside those buckets, and the highest-volume bucket becomes the developing Point of Control. Value Area High and Value Area Low are calculated around the Point of Control using the selected value area percentage.
Fair Value Gap logic:
Fair Value Gap zones are based on a three-candle imbalance model. A bullish gap is detected when the high from two candles back is below the current low. A bearish gap is detected when the low from two candles back is above the current high. Filled gaps can be removed automatically.
How to use:
Use this indicator as a market reading map. Watch how price behaves around VWAP, Initial Balance, previous session references, value area levels and fair value gaps. Reaction, acceptance and rejection around these levels can help traders build context.
This script is for educational and analytical use only. It does not provide financial advice, investment advice, trading recommendations, buy signals or sell signals. Traders should use their own analysis, risk management and decision-making.
CLBS stands for Context, Levels, Behavior and Strategy.
This script combines multiple market reference concepts into one structured visual map. The purpose is not to generate buy or sell signals, but to help traders observe where price may react, accept, reject, rotate or expand.
Main components:
• Developing day levels
• Previous day levels
• Developing week levels
• Previous week levels
• Developing month levels
• Previous month levels
• Initial Balance High and Initial Balance Low
• Initial Balance range projection
• Developing day Point of Control, Value Area High and Value Area Low
• Daily, Weekly, Monthly, Quarterly and Yearly VWAP
• Optional VWAP bands
• Fair Value Gap zones using three-candle imbalance logic
VWAP logic:
The VWAP hierarchy uses anchored VWAP calculations for different periods. Daily VWAP resets at the start of each new day. Weekly VWAP resets at the start of each new week. Monthly VWAP resets at the start of each new month. Quarterly VWAP resets every three months. Yearly VWAP resets at the start of each new year.
VWAP is calculated using cumulative price multiplied by volume divided by cumulative volume for the selected period.
Value area logic:
The developing day value area uses a simple volume distribution model. Price is divided into buckets, volume is accumulated inside those buckets, and the highest-volume bucket becomes the developing Point of Control. Value Area High and Value Area Low are calculated around the Point of Control using the selected value area percentage.
Fair Value Gap logic:
Fair Value Gap zones are based on a three-candle imbalance model. A bullish gap is detected when the high from two candles back is below the current low. A bearish gap is detected when the low from two candles back is above the current high. Filled gaps can be removed automatically.
How to use:
Use this indicator as a market reading map. Watch how price behaves around VWAP, Initial Balance, previous session references, value area levels and fair value gaps. Reaction, acceptance and rejection around these levels can help traders build context.
This script is for educational and analytical use only. It does not provide financial advice, investment advice, trading recommendations, buy signals or sell signals. Traders should use their own analysis, risk management and decision-making.
Скрипт с открытым кодом
В истинном духе TradingView, создатель этого скрипта сделал его открытым исходным кодом, чтобы трейдеры могли проверить и убедиться в его функциональности. Браво автору! Вы можете использовать его бесплатно, но помните, что перепубликация кода подчиняется нашим Правилам поведения.

Отказ от ответственности
Информация и публикации не предназначены для предоставления и не являются финансовыми, инвестиционными, торговыми или другими видами советов или рекомендаций, предоставленных или одобренных TradingView. Подробнее читайте в Условиях использования.
Скрипт с открытым кодом
В истинном духе TradingView, создатель этого скрипта сделал его открытым исходным кодом, чтобы трейдеры могли проверить и убедиться в его функциональности. Браво автору! Вы можете использовать его бесплатно, но помните, что перепубликация кода подчиняется нашим Правилам поведения.
Отказ от ответственности
Информация и публикации не предназначены для предоставления и не являются финансовыми, инвестиционными, торговыми или другими видами советов или рекомендаций, предоставленных или одобренных TradingView. Подробнее читайте в Условиях использования.