OPEN-SOURCE SCRIPT
SOPR Percentile Oscillator | Astral Vision
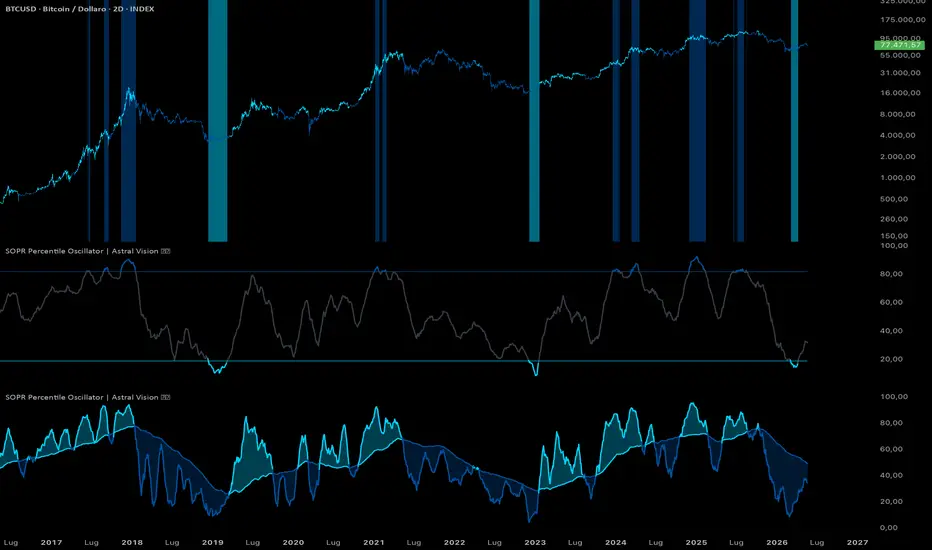
SOPR Percentile Oscillator | Astral Vision 🌠💠
This indicator transforms the Spent Output Profit Ratio into a percentile-ranked oscillator, measuring where today's SOPR reading sits relative to its own history over a configurable lookback window. SOPR is an on-chain metric that divides the realized value of all Bitcoin outputs spent on a given day by their value at the time they were created: a reading above 1.0 means coins are being sold at a profit on aggregate, below 1.0 means coins are being sold at a loss.
Calculation ⚙️
The raw SOPR is fetched from Glassnode on a daily timeframe. A percentile rank is then computed over a configurable lookback window using `ta.percentrank`, which counts how many of the past N values are lower than the current value and expresses the result as a percentage from 0 to 100. A reading of 85 means the current SOPR is higher than 85% of all daily readings over the lookback period, placing it in historically elevated territory. A reading of 15 means SOPR is lower than 85% of historical readings, placing it in historically depressed territory.
Two simple moving averages are applied to the percentile rank series: a short-term SMA over a configurable window (default 30 days) that captures recent momentum, and a long-term SMA over a configurable window (default 365 days) that represents the structural trend of the percentile rank. The short-term SMA is the primary signal line; the long-term SMA is used in Trend mode as the reference for directional classification.
The indicator operates in two modes.
Plots 📊
Inputs 🎛️
Colors 🎨
5 Astral Vision presets + custom override. Default: Paradiso.
Purpose 🎯
Raw SOPR fluctuates around 1.0 on an expanding scale as Bitcoin matures, making fixed absolute thresholds unreliable across different market cycles. Converting to a percentile rank normalizes the series against its own historical distribution, so a percentile reading of 85 in 2017 and a reading of 85 in 2024 are statistically equivalent statements about how extreme current on-chain profit-taking behavior is relative to its own history. The dual SMA structure further separates short-term extremes from structural regime shifts, which are analytically distinct signals that a single moving average cannot distinguish.
Disclaimer ⭕️
This indicator is for informational and educational purposes only. It does not constitute financial advice. Past performance is not indicative of future results. Always do your own research before making investment decisions.
This indicator transforms the Spent Output Profit Ratio into a percentile-ranked oscillator, measuring where today's SOPR reading sits relative to its own history over a configurable lookback window. SOPR is an on-chain metric that divides the realized value of all Bitcoin outputs spent on a given day by their value at the time they were created: a reading above 1.0 means coins are being sold at a profit on aggregate, below 1.0 means coins are being sold at a loss.
Calculation ⚙️
The raw SOPR is fetched from Glassnode on a daily timeframe. A percentile rank is then computed over a configurable lookback window using `ta.percentrank`, which counts how many of the past N values are lower than the current value and expresses the result as a percentage from 0 to 100. A reading of 85 means the current SOPR is higher than 85% of all daily readings over the lookback period, placing it in historically elevated territory. A reading of 15 means SOPR is lower than 85% of historical readings, placing it in historically depressed territory.
Two simple moving averages are applied to the percentile rank series: a short-term SMA over a configurable window (default 30 days) that captures recent momentum, and a long-term SMA over a configurable window (default 365 days) that represents the structural trend of the percentile rank. The short-term SMA is the primary signal line; the long-term SMA is used in Trend mode as the reference for directional classification.
The indicator operates in two modes.
- Extremes mode colors the oscillator neutrally between the configurable overbought and oversold percentile thresholds, and highlights only when the short-term SMA enters one of the two extreme zones, also applying background color to the price chart.
- Trend mode compares the short-term SMA against the long-term SMA: when the short is above the long, the regime is bullish; when below, bearish. A fill between the two lines visually represents the spread between short and long-term percentile positioning.
Plots 📊
- Short-term SMA of the SOPR percentile rank, colored by mode and regime
- Long-term SMA of the SOPR percentile rank (Trend mode only)
- Fill between short and long-term SMA (Trend mode only)
- Overbought and oversold percentile threshold lines (Extremes mode only)
- Background color on the price chart when short SMA enters extreme zones (Extremes mode)
- Candle coloring on the price chart reflecting current regime in both modes
Inputs 🎛️
- Mode: Extremes or Trend
- Short Term SMA: smoothing window applied to the percentile rank for the signal line
- Long Term SMA: smoothing window for the structural trend reference
- Lookback: historical window for the percentile rank computation
- Overbought Threshold: upper percentile level marking historically elevated SOPR
- Oversold Threshold: lower percentile level marking historically depressed SOPR
Colors 🎨
5 Astral Vision presets + custom override. Default: Paradiso.
Purpose 🎯
Raw SOPR fluctuates around 1.0 on an expanding scale as Bitcoin matures, making fixed absolute thresholds unreliable across different market cycles. Converting to a percentile rank normalizes the series against its own historical distribution, so a percentile reading of 85 in 2017 and a reading of 85 in 2024 are statistically equivalent statements about how extreme current on-chain profit-taking behavior is relative to its own history. The dual SMA structure further separates short-term extremes from structural regime shifts, which are analytically distinct signals that a single moving average cannot distinguish.
Disclaimer ⭕️
This indicator is for informational and educational purposes only. It does not constitute financial advice. Past performance is not indicative of future results. Always do your own research before making investment decisions.
Скрипт с открытым кодом
В истинном духе TradingView, создатель этого скрипта сделал его открытым исходным кодом, чтобы трейдеры могли проверить и убедиться в его функциональности. Браво автору! Вы можете использовать его бесплатно, но помните, что перепубликация кода подчиняется нашим Правилам поведения.

My premium indicators are available on Whop:
whop.com/astralvision
Astral Vision 🌠💠
whop.com/astralvision
Astral Vision 🌠💠
Отказ от ответственности
Информация и публикации не предназначены для предоставления и не являются финансовыми, инвестиционными, торговыми или другими видами советов или рекомендаций, предоставленных или одобренных TradingView. Подробнее читайте в Условиях использования.
Скрипт с открытым кодом
В истинном духе TradingView, создатель этого скрипта сделал его открытым исходным кодом, чтобы трейдеры могли проверить и убедиться в его функциональности. Браво автору! Вы можете использовать его бесплатно, но помните, что перепубликация кода подчиняется нашим Правилам поведения.
My premium indicators are available on Whop:
whop.com/astralvision
Astral Vision 🌠💠
whop.com/astralvision
Astral Vision 🌠💠
Отказ от ответственности
Информация и публикации не предназначены для предоставления и не являются финансовыми, инвестиционными, торговыми или другими видами советов или рекомендаций, предоставленных или одобренных TradingView. Подробнее читайте в Условиях использования.