BOS + Displacement
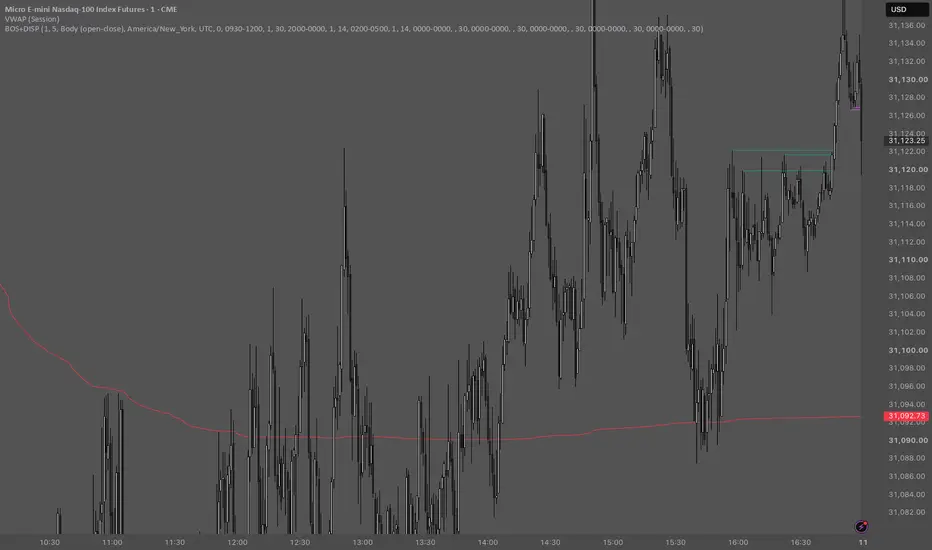
BOS + Displacement
This indicator does two things: it draws a line every time price breaks a local high or low (Break of Structure), and it highlights candles that move more than a set number of points (displacement candles).
Break of Structure lines
The script marks every local swing high and swing low. A swing low is a candle whose low is lower than the lows of the candles on both sides; a swing high is the reverse.
When a later candle closes beyond one of those levels, a horizontal line is drawn from the swing point to the candle that broke it.
Breaks to the upside are teal, breaks to the downside are fuchsia.
All unbroken levels are tracked at the same time (up to 50 per side), so an older level can still produce a line when price finally reaches it.
Signals only appear on closed candles, so lines do not repaint.
Displacement candles
A candle is recolored when its move is at least the point threshold that applies at that moment. Up candles turn green, down candles turn red.
The move is measured either as the body (open to close) or as the full range (high to low).
Thresholds are set through up to 8 rules. Each rule has a time window, a timeframe and a number of points, so every session can have its own threshold.
A rule only applies when the chart is on the rule’s timeframe. Set the timeframe to “Chart” to make a rule apply on every timeframe.
If several rules match the same candle, the lowest rule number wins.
Settings
Setting What it does
Swing length Number of candles on each side needed to confirm a swing. 1 marks every small turn; higher values give fewer, larger levels.
Max. number of lines How many BOS lines stay on the chart. The oldest is removed when the limit is reached.
Break requires a close On: only a close beyond the level counts. Off: a wick through the level also counts.
Show bullish / bearish breaks Turn each direction on or off.
Measure move as Body or full range for displacement candles.
Session time zone Time zone used for the rule time windows. Includes the exchange time zone and a free-text option.
Points if no rule matches Fallback threshold outside all rules. 0 means no coloring.
Rules 1–8 On/off, time window, timeframe and points for each rule.
Default rules (New York time, 1-minute chart)
Rule Time Points
1 09:30–12:00 30
2 20:00–00:00 14
3 02:00–05:00 14
Alerts
Three alert conditions are available: Bullish BOS, Bearish BOS and Displacement candle.
Limitations
A swing is only confirmed after the candles to its right have closed, so levels appear with a delay equal to the swing length.
With swing length 1 the script marks every minor break in both directions. It does not filter by trend and does not separate BOS from CHoCH.
The line limit hides older lines; it does not filter out weak signals.
Point thresholds are fixed values. They fit one instrument, one timeframe and the current volatility, and need to be adjusted when any of those change.
The indicator shows structure and momentum that have already happened. It does not predict direction and is not a trading signal on its own.
This indicator does two things: it draws a line every time price breaks a local high or low (Break of Structure), and it highlights candles that move more than a set number of points (displacement candles).
Break of Structure lines
The script marks every local swing high and swing low. A swing low is a candle whose low is lower than the lows of the candles on both sides; a swing high is the reverse.
When a later candle closes beyond one of those levels, a horizontal line is drawn from the swing point to the candle that broke it.
Breaks to the upside are teal, breaks to the downside are fuchsia.
All unbroken levels are tracked at the same time (up to 50 per side), so an older level can still produce a line when price finally reaches it.
Signals only appear on closed candles, so lines do not repaint.
Displacement candles
A candle is recolored when its move is at least the point threshold that applies at that moment. Up candles turn green, down candles turn red.
The move is measured either as the body (open to close) or as the full range (high to low).
Thresholds are set through up to 8 rules. Each rule has a time window, a timeframe and a number of points, so every session can have its own threshold.
A rule only applies when the chart is on the rule’s timeframe. Set the timeframe to “Chart” to make a rule apply on every timeframe.
If several rules match the same candle, the lowest rule number wins.
Settings
Setting What it does
Swing length Number of candles on each side needed to confirm a swing. 1 marks every small turn; higher values give fewer, larger levels.
Max. number of lines How many BOS lines stay on the chart. The oldest is removed when the limit is reached.
Break requires a close On: only a close beyond the level counts. Off: a wick through the level also counts.
Show bullish / bearish breaks Turn each direction on or off.
Measure move as Body or full range for displacement candles.
Session time zone Time zone used for the rule time windows. Includes the exchange time zone and a free-text option.
Points if no rule matches Fallback threshold outside all rules. 0 means no coloring.
Rules 1–8 On/off, time window, timeframe and points for each rule.
Default rules (New York time, 1-minute chart)
Rule Time Points
1 09:30–12:00 30
2 20:00–00:00 14
3 02:00–05:00 14
Alerts
Three alert conditions are available: Bullish BOS, Bearish BOS and Displacement candle.
Limitations
A swing is only confirmed after the candles to its right have closed, so levels appear with a delay equal to the swing length.
With swing length 1 the script marks every minor break in both directions. It does not filter by trend and does not separate BOS from CHoCH.
The line limit hides older lines; it does not filter out weak signals.
Point thresholds are fixed values. They fit one instrument, one timeframe and the current volatility, and need to be adjusted when any of those change.
The indicator shows structure and momentum that have already happened. It does not predict direction and is not a trading signal on its own.

Отказ от ответственности
Информация и публикации не предназначены для предоставления и не являются финансовыми, инвестиционными, торговыми или другими видами советов или рекомендаций, предоставленных или одобренных TradingView. Подробнее читайте в Условиях использования.
Отказ от ответственности
Информация и публикации не предназначены для предоставления и не являются финансовыми, инвестиционными, торговыми или другими видами советов или рекомендаций, предоставленных или одобренных TradingView. Подробнее читайте в Условиях использования.