Обновлено
Fulcrum: volume-weighted average of a two-market ratio
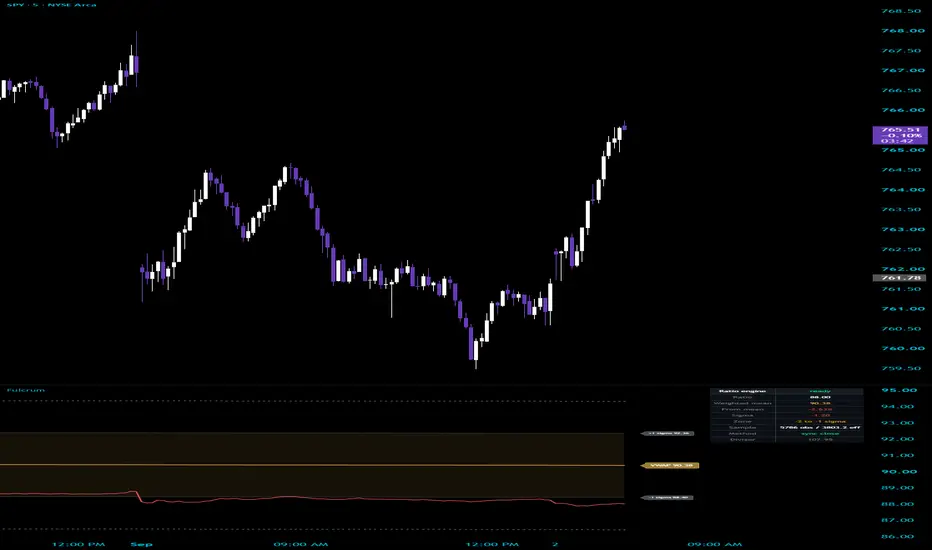
A volume-weighted average price computed on the relationship between two markets rather than on a single price, with dispersion bands built from the same weighted pass.
What it does
Most relative-value work is done by eye: put two markets on one chart, watch the spread, decide when it looks stretched. This computes that judgement. It takes the ratio between two instruments, defaults to the Nasdaq and S&P futures contracts, and runs a volume-weighted average through it with standard deviation bands around that average. It lives in its own pane on its own scale, so the symbol you happen to have loaded is irrelevant to the reading.
What is different here
Volume-weighted average price, standard deviation bands and ratio charting are all public methodology and I claim none of them. The reason this is one script rather than three is the problem in the middle, which is that a ratio has no volume of its own.
If you divide one market by another, the resulting series has a price and no trade behind it. Every implementation has to decide what to weight by, and most sidestep it by using a simple moving average, which throws away the participation information entirely.
Three specific choices follow from taking that problem seriously.
First, the weight is the geometric mean of both legs' volume rather than either leg alone or their sum. A bar where both markets traded heavily is genuine two-sided participation in the relationship. A bar where one leg was busy and the other was dead is not, and the geometric mean punishes that asymmetry in a way an average does not.
Second, the variance is accumulated in the same volume-weighted pass as the mean, using running sums of weighted value and weighted squared value. The bands therefore describe the dispersion of the ratio as it was actually traded, not the standard deviation of the drawn line. Those two are not the same number and the difference matters most exactly when participation is uneven.
Third, the ratio can be normalised by a volatility and rates term, and that term is frozen at each anchor reset rather than updated daily. This matters more than it sounds. The volatility and rates inputs move once a day, so on any anchor longer than a session the divisor would step in the middle of the window being averaged, and you cannot take a volume-weighted average of a quantity whose units change halfway through: the mean chases the step and the variance ends up describing the divisor instead of the two markets. Freezing it means the unit is constant across the window and the level shift lands exactly where the average restarts anyway. Both inputs are read from the prior session's confirmed close, so the value is identical live and on reload, and when either feed is unavailable the table reports the fallback rather than changing every number on screen silently.
How it works
The ratio is computed from both legs bar by bar, including a high and low estimate taken from the most and least favourable combination of the two legs' extremes, so the typical price is a real range rather than just the close.
Volume for the weighting is the geometric mean of the two legs. The average, and the variance around it, accumulate from the anchor point using running weighted sums.
The anchor resets on a schedule, and by default that schedule is chosen from your chart: session on intraday timeframes up to twenty minutes, weekly up to four hours, monthly above that. The point is that an anchor should outlive more than a handful of bars, and a session anchor on a four hour chart does not. You can override it if you disagree.
Bands are hidden for the first few bars after each reset, and the distance reading is suppressed along with them. Cumulative dispersion on two or three samples is tiny but not zero, and dividing by it turns a two-basis-point wiggle into a double-digit sigma reading. Until the window has enough behind it to have measured anything, the readout says it is warming up rather than inventing an extension, and the band alerts stay silent.
The ratio line is coloured by which side of the average it sits on, with a small dead zone so that a ratio hugging its average does not strobe the line bar by bar.
How to use it
Load it on any chart. The pane draws the relationship, not your symbol.
Read the distance in standard deviations rather than the absolute level, which is reported in the table. The absolute number depends on the multiplier and the divisor and means nothing on its own.
The table reports whether both feeds are live, the current average, the current ratio, the distance from the average in percent and in standard deviations, which zone the ratio occupies, and the divisor with a fallback flag if either input is missing. Check the feed status first if the numbers look wrong.
Change the two symbols to compare any pair you like. The scaling multiplier exists to bring the ratio into a readable range and has no effect on the shape.
What it cannot do
It describes a relationship and not a direction. A stretched ratio tells you the two markets have diverged from how they have recently traded together. It does not tell you which leg corrects, or whether either does, or when. Relationships can stay stretched for as long as the reason for the stretch persists.
Standard deviation bands assume a distribution that ratio spreads do not reliably follow. Two sigma here is a description of the recent sample, not a probability of anything.
Requesting two symbols means depending on two data feeds. If either is unavailable on your plan or a symbol is wrong, the reading is incomplete, which is why the table reports feed status rather than drawing a confident line over missing data.
The volatility and rates divisor falls back to fixed placeholder values when its feeds are missing. Those numbers are arbitrary and they change the scale of everything on screen. The table flags it.
There are no entries, exits or trade marks anywhere in this script, and no performance of any kind is claimed or implied.
On authorship
The methodology is public and I have said so plainly. The implementation is not borrowed. Every line is written from scratch, and no code in it is copied or adapted from another author's script on this platform or anywhere else.
Settings
The two ratio symbols and a scaling multiplier; the volatility and rates divisor with its two symbols and an on-off switch; anchor period with an automatic default, band multipliers, band visibility and the post-reset warm-up length; and visual settings for colours, line width, fill, labels, the info table and the extension tint.
What it does
Most relative-value work is done by eye: put two markets on one chart, watch the spread, decide when it looks stretched. This computes that judgement. It takes the ratio between two instruments, defaults to the Nasdaq and S&P futures contracts, and runs a volume-weighted average through it with standard deviation bands around that average. It lives in its own pane on its own scale, so the symbol you happen to have loaded is irrelevant to the reading.
What is different here
Volume-weighted average price, standard deviation bands and ratio charting are all public methodology and I claim none of them. The reason this is one script rather than three is the problem in the middle, which is that a ratio has no volume of its own.
If you divide one market by another, the resulting series has a price and no trade behind it. Every implementation has to decide what to weight by, and most sidestep it by using a simple moving average, which throws away the participation information entirely.
Three specific choices follow from taking that problem seriously.
First, the weight is the geometric mean of both legs' volume rather than either leg alone or their sum. A bar where both markets traded heavily is genuine two-sided participation in the relationship. A bar where one leg was busy and the other was dead is not, and the geometric mean punishes that asymmetry in a way an average does not.
Second, the variance is accumulated in the same volume-weighted pass as the mean, using running sums of weighted value and weighted squared value. The bands therefore describe the dispersion of the ratio as it was actually traded, not the standard deviation of the drawn line. Those two are not the same number and the difference matters most exactly when participation is uneven.
Third, the ratio can be normalised by a volatility and rates term, and that term is frozen at each anchor reset rather than updated daily. This matters more than it sounds. The volatility and rates inputs move once a day, so on any anchor longer than a session the divisor would step in the middle of the window being averaged, and you cannot take a volume-weighted average of a quantity whose units change halfway through: the mean chases the step and the variance ends up describing the divisor instead of the two markets. Freezing it means the unit is constant across the window and the level shift lands exactly where the average restarts anyway. Both inputs are read from the prior session's confirmed close, so the value is identical live and on reload, and when either feed is unavailable the table reports the fallback rather than changing every number on screen silently.
How it works
The ratio is computed from both legs bar by bar, including a high and low estimate taken from the most and least favourable combination of the two legs' extremes, so the typical price is a real range rather than just the close.
Volume for the weighting is the geometric mean of the two legs. The average, and the variance around it, accumulate from the anchor point using running weighted sums.
The anchor resets on a schedule, and by default that schedule is chosen from your chart: session on intraday timeframes up to twenty minutes, weekly up to four hours, monthly above that. The point is that an anchor should outlive more than a handful of bars, and a session anchor on a four hour chart does not. You can override it if you disagree.
Bands are hidden for the first few bars after each reset, and the distance reading is suppressed along with them. Cumulative dispersion on two or three samples is tiny but not zero, and dividing by it turns a two-basis-point wiggle into a double-digit sigma reading. Until the window has enough behind it to have measured anything, the readout says it is warming up rather than inventing an extension, and the band alerts stay silent.
The ratio line is coloured by which side of the average it sits on, with a small dead zone so that a ratio hugging its average does not strobe the line bar by bar.
How to use it
Load it on any chart. The pane draws the relationship, not your symbol.
Read the distance in standard deviations rather than the absolute level, which is reported in the table. The absolute number depends on the multiplier and the divisor and means nothing on its own.
The table reports whether both feeds are live, the current average, the current ratio, the distance from the average in percent and in standard deviations, which zone the ratio occupies, and the divisor with a fallback flag if either input is missing. Check the feed status first if the numbers look wrong.
Change the two symbols to compare any pair you like. The scaling multiplier exists to bring the ratio into a readable range and has no effect on the shape.
What it cannot do
It describes a relationship and not a direction. A stretched ratio tells you the two markets have diverged from how they have recently traded together. It does not tell you which leg corrects, or whether either does, or when. Relationships can stay stretched for as long as the reason for the stretch persists.
Standard deviation bands assume a distribution that ratio spreads do not reliably follow. Two sigma here is a description of the recent sample, not a probability of anything.
Requesting two symbols means depending on two data feeds. If either is unavailable on your plan or a symbol is wrong, the reading is incomplete, which is why the table reports feed status rather than drawing a confident line over missing data.
The volatility and rates divisor falls back to fixed placeholder values when its feeds are missing. Those numbers are arbitrary and they change the scale of everything on screen. The table flags it.
There are no entries, exits or trade marks anywhere in this script, and no performance of any kind is claimed or implied.
On authorship
The methodology is public and I have said so plainly. The implementation is not borrowed. Every line is written from scratch, and no code in it is copied or adapted from another author's script on this platform or anywhere else.
Settings
The two ratio symbols and a scaling multiplier; the volatility and rates divisor with its two symbols and an on-off switch; anchor period with an automatic default, band multipliers, band visibility and the post-reset warm-up length; and visual settings for colours, line width, fill, labels, the info table and the extension tint.
Информация о релизе
Fix release. One correctness fix to anchor resets, two display corrections.Anchor resets can no longer be skipped. The reset clock is read in the numerator's exchange context, and when the numerator had no bar exactly on an anchor boundary, the missing value silently suppressed the reset — the weighted mean, the bands, and the frozen risk divisor then carried the entire previous period forward. The chart clock now stands in for exactly that bar, so every session, week, or month starts a fresh ledger even when a leg gaps on the boundary.
The effective-N readout used an invalid number pattern that printed a fabricated decimal digit. It now shows the true value to one decimal.
The sigma and distance-from-mean readouts now sign their values explicitly instead of relying on a formatting feature the platform does not support.
The zone description now reflects your configured band multipliers instead of a hard-coded 1 and 2, so custom bands read correctly in the dashboard.
The source header now states that both legs must report volume, since the weight is their geometric mean; a leg without volume, such as a cash index, produces no observations.

Отказ от ответственности
Информация и публикации не предназначены для предоставления и не являются финансовыми, инвестиционными, торговыми или другими видами советов или рекомендаций, предоставленных или одобренных TradingView. Подробнее читайте в Условиях использования.
Отказ от ответственности
Информация и публикации не предназначены для предоставления и не являются финансовыми, инвестиционными, торговыми или другими видами советов или рекомендаций, предоставленных или одобренных TradingView. Подробнее читайте в Условиях использования.