Обновлено
[blackcat] L1 Blackcat Customized CCI Indicator
Level: 1
Background
This CCI indicator is blackcat customized version with enhanced features.
Function
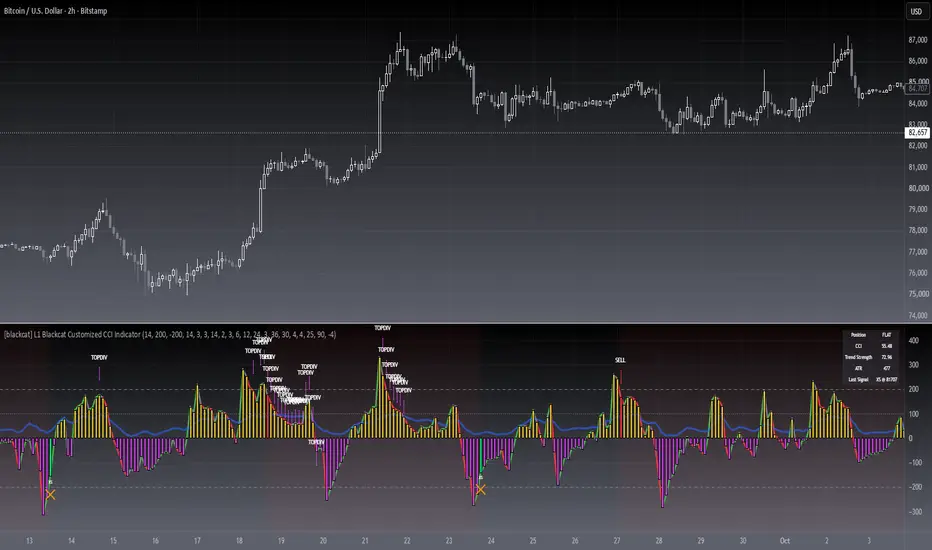
This CCI use green line to indicate strong long trend with cci values > 0 and red line to indicate weak long trend with cci values <0. It also use yellow and fuchsia candles to present the strong and weak long trend. A green candle is used to indicate long entry, while a red candle is usded to indicate long flatten signal.
Key Signal
green line --> strong long trend
red line --> weak long trend
blue line --> trend strength indicator
SELL label --> flatten long or short entry
BUY label --> long entry
TOPDIV label --> top divergence indicator
BOTDIV label --> bottom divergence indicator
Remarks
Feedbacks are appreciated.
Readme
In real life, I am a prolific inventor. I have successfully applied for more than 60 international and regional patents in the past 12 years. But in the past two years or so, I have tried to transfer my creativity to the development of trading strategies. Tradingview is the ideal platform for me. I am selecting and contributing some of the hundreds of scripts to publish in Tradingview community. Welcome everyone to interact with me to discuss these interesting pine scripts.
The scripts posted are categorized into 5 levels according to my efforts or manhours put into these works.
Level 1 : interesting script snippets or distinctive improvement from classic indicators or strategy. Level 1 scripts can usually appear in more complex indicators as a function module or element.
Level 2 : composite indicator/strategy. By selecting or combining several independent or dependent functions or sub indicators in proper way, the composite script exhibits a resonance phenomenon which can filter out noise or fake trading signal to enhance trading confidence level.
Level 3 : comprehensive indicator/strategy. They are simple trading systems based on my strategies. They are commonly containing several or all of entry signal, close signal, stop loss, take profit, re-entry, risk management, and position sizing techniques. Even some interesting fundamental and mass psychological aspects are incorporated.
Level 4 : script snippets or functions that do not disclose source code. Interesting element that can reveal market laws and work as raw material for indicators and strategies. If you find Level 1~2 scripts are helpful, Level 4 is a private version that took me far more efforts to develop.
Level 5 : indicator/strategy that do not disclose source code. private version of Level 3 script with my accumulated script processing skills or a large number of custom functions. I had a private function library built in past two years. Level 5 scripts use many of them to achieve private trading strategy.
Background
This CCI indicator is blackcat customized version with enhanced features.
Function
This CCI use green line to indicate strong long trend with cci values > 0 and red line to indicate weak long trend with cci values <0. It also use yellow and fuchsia candles to present the strong and weak long trend. A green candle is used to indicate long entry, while a red candle is usded to indicate long flatten signal.
Key Signal
green line --> strong long trend
red line --> weak long trend
blue line --> trend strength indicator
SELL label --> flatten long or short entry
BUY label --> long entry
TOPDIV label --> top divergence indicator
BOTDIV label --> bottom divergence indicator
Remarks
Feedbacks are appreciated.
Readme
In real life, I am a prolific inventor. I have successfully applied for more than 60 international and regional patents in the past 12 years. But in the past two years or so, I have tried to transfer my creativity to the development of trading strategies. Tradingview is the ideal platform for me. I am selecting and contributing some of the hundreds of scripts to publish in Tradingview community. Welcome everyone to interact with me to discuss these interesting pine scripts.
The scripts posted are categorized into 5 levels according to my efforts or manhours put into these works.
Level 1 : interesting script snippets or distinctive improvement from classic indicators or strategy. Level 1 scripts can usually appear in more complex indicators as a function module or element.
Level 2 : composite indicator/strategy. By selecting or combining several independent or dependent functions or sub indicators in proper way, the composite script exhibits a resonance phenomenon which can filter out noise or fake trading signal to enhance trading confidence level.
Level 3 : comprehensive indicator/strategy. They are simple trading systems based on my strategies. They are commonly containing several or all of entry signal, close signal, stop loss, take profit, re-entry, risk management, and position sizing techniques. Even some interesting fundamental and mass psychological aspects are incorporated.
Level 4 : script snippets or functions that do not disclose source code. Interesting element that can reveal market laws and work as raw material for indicators and strategies. If you find Level 1~2 scripts are helpful, Level 4 is a private version that took me far more efforts to develop.
Level 5 : indicator/strategy that do not disclose source code. private version of Level 3 script with my accumulated script processing skills or a large number of custom functions. I had a private function library built in past two years. Level 5 scripts use many of them to achieve private trading strategy.
Информация о релизе
OVERVIEWThe [blackcat] L1 Blackcat Customized CCI Indicator is a comprehensive technical analysis tool that combines the Commodity Channel Index (CCI) with additional features for enhanced trading insights. 📈
FEATURES
• Advanced CCI Implementation:
Customizable CCI calculation with 14-period default setting
Dynamic color changes based on price movement
Trend strength visualization
• Trading Signals:
Buy/Sell labels with directional arrows
Strong buy/sell alerts with momentum confirmation
Divergence detection for potential reversal points
• Visual Elements:
Multiple horizontal reference lines
Color-coded candlestick patterns
Trend strength indicator overlay
HOW TO USE
Add the indicator to your chart
Monitor the CCI line for overbought/oversold conditions
Look for signal labels (BUY/SELL) for entry/exit opportunities
Pay attention to divergence alerts for potential reversals
Use trend strength indicator for market direction confirmation
LIMITATIONS
• The indicator should not be used in isolation
• Best results when combined with other technical analysis tools
• Market conditions may affect signal reliability
NOTES
• Default settings are optimized for most markets
• Adjust parameters based on your trading strategy
• Regular backtesting recommended for optimal performance
Информация о релизе
█ OVERVIEWA mean-reversion CCI oscillator that flags oversold recoveries and overbought fade-outs with state-governed signals, ATR-based take-profit and stop-loss references, and composite BIAS divergence detection. Version 2 adds a position state machine, cooldown control, a status dashboard and an eight-channel alert suite.
█ CONCEPTS
• CCI mean reversion: pushes beyond the ±200 bands mark statistically stretched conditions; a recovery back above the lower band with upward momentum prints BUY, a rollover back below the upper band prints SELL.
• Trend strength: a smoothed range-position percentage (0-100), plotted as the blue reference line.
• Divergence detection: a weighted composite of three BIAS spreads plus a range-position oscillator; extreme readings flag potential tops (TOPDIV) or capitulation (BOTDIV).
Signal governance: an internal LONG / SHORT / FLAT state machine suppresses repeated same-direction triggers and alternates entries with exits; a configurable cooldown blocks rapid-fire signals in choppy conditions.
█ HOW TO USE
1 — Add the indicator to a pane below your chart; defaults work out of the box.
2 — Tune CCI Length and the band levels to your market; keep bands symmetric for balanced signals.
3 — Confirm signals with the trend strength line (above 50 favors longs, below 50 favors shorts).
4 — Create TradingView alerts from any of the eight alert conditions.
Input Parameters
• CCI Length (14); Overbought / Oversold Level (±200); Trend Strength Length / Smoothing (14 / 3).
• Enable Signal Governance (on); Cooldown Bars (3, 0 = off) — off restores raw V1-style signals.
• Show TP/SL Reference Levels (on); ATR Length 14; Stop Loss 2.0 xATR; Take Profit 3.0 xATR.
• Divergence group: BIAS lengths 6/12/24, composite smoothing 3, extreme lookbacks 36/30, oscillator EMA 4, thresholds 90 / -4.
• Visual group: position background tint and dashboard toggles.
█ FEATURES
• State-governed BUY / SELL arrows plus XL / XS exit crosses.
• ATR-based take-profit and stop-loss reference lines that follow each governed entry.
• Position background tint (green LONG, red SHORT) and an on-chart dashboard (position, CCI, trend strength, ATR, last signal).
• Color-coded CCI candles: lime at buy crosses, red at sell crosses, yellow above zero, magenta below zero.
• Eight alertcondition channels: raw and governed signals plus both divergence directions.
█ SIGNALS
• BUY (green up arrow): CCI crossed back above the oversold band with momentum while not already long.
• SELL (red down arrow): CCI crossed back below the overbought band with momentum while not already short.
• XL / XS (orange cross): governed exit of a long / short position.
• TOPDIV (magenta down arrow): divergence oscillator above threshold — potential top.
• BOTDIV (yellow up arrow): composite BIAS line below threshold — potential bottom.
█ IMPLEMENTATION NOTES
• Open-source (MPL 2.0). Built on ta.sma, ta.dev, ta.atr, ta.crossover / ta.crossunder, ta.lowest / ta.highest and ta.ema; no request.security calls, so no higher-timeframe repaint surface.
• Signals evaluate on closed bars; labels are capped at 500.
• Every threshold is an input with sane bounds; defaults reproduce V1 behavior with governance enabled.
█ LIMITATIONS
• Mean-reversion logic underperforms in strong one-way trends; fade signals against an established trend can repeat.
• Divergence readings are early warnings, not timing tools — wait for confirmation from price or the trend strength line.
• TP/SL lines are reference levels, not executed orders — this is an indicator, not a strategy.
█ NOTES
• Version 2 keeps the original CCI, trend strength and divergence engines unchanged; all behavioral additions are toggleable back to V1-style raw signals.
• License: Mozilla Public License 2.0. Credit: blackcat1402.
═════════════════════════════════════════════════════════════════════════
For questions or feedback, use the comments section below.
Feel free to use and modify — attribution appreciated.

Don't miss out! The first and most important thing to do is to join my Discord chat now! Click here to start your adventure: discord.com/invite/ZTGpQJq My new github for more pine development soon: github.com/wxt-coder
Отказ от ответственности
Информация и публикации не предназначены для предоставления и не являются финансовыми, инвестиционными, торговыми или другими видами советов или рекомендаций, предоставленных или одобренных TradingView. Подробнее читайте в Условиях использования.
Don't miss out! The first and most important thing to do is to join my Discord chat now! Click here to start your adventure: discord.com/invite/ZTGpQJq My new github for more pine development soon: github.com/wxt-coder
Отказ от ответственности
Информация и публикации не предназначены для предоставления и не являются финансовыми, инвестиционными, торговыми или другими видами советов или рекомендаций, предоставленных или одобренных TradingView. Подробнее читайте в Условиях использования.