Market Rotor - Phase-Space Rotation Geometry [FibonacciFlux]
Third in a series of published experiments. The first script asked whether an observed rotation survives a null. The second asked whether the circulation between price and flow is just the price increment leaking into the flow axis. This one publishes the full phase-space geometry those two were carved out of, and then applies the same treatment to its own headline verdict.
The verdict does not survive. Against a null that breaks only the thing being tested, the orbital-rotation state is not distinguishable from noise on BTCUSDT and is worse than noise on ETHUSDT. The numbers are below and the indicator ships with the state still labelled, because a label you can check is more useful than one quietly removed.
🔶 USAGE
🔹 What is in the pane
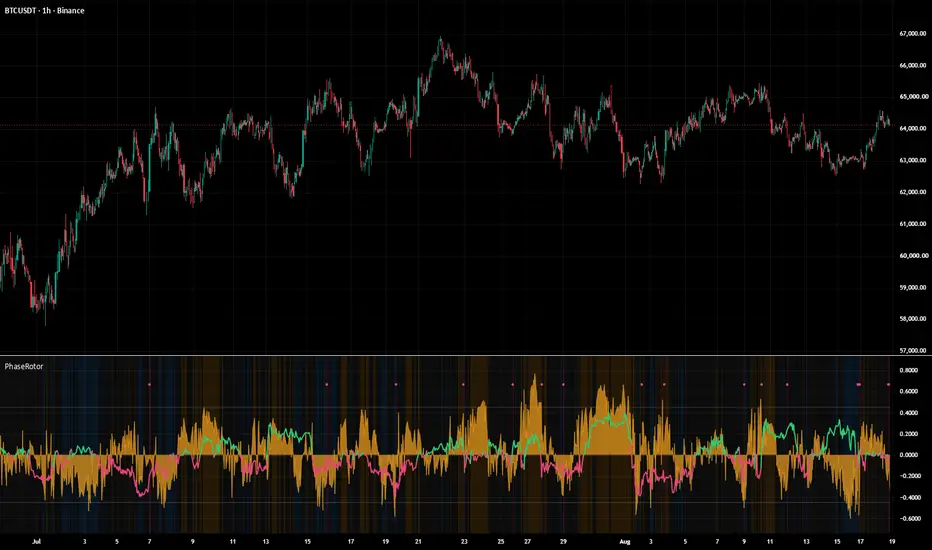
Two dimensionless series share one scale by design. C is the signed rotation consistency - net turning divided by total turning over a window, bounded to [-1, 1]. S* is a spiral index, tanh-compressed to the same range, positive when the trajectory winds outward. The bands behind them are the regime label; the dots along the top are phase slips.
Angular velocity ω is off by default, and that is a units decision rather than a judgement. C and S* are dimensionless; ω is rad/bar and reaches ‖ω‖ of 1.92 on BTCUSDT 1H against 0.597 for C and 0.768 for S*. Sharing an axis, it sets the scale and flattens the two series the pane exists to show. Turn it on and expect the pane to rescale.
🔹 Where the numbers come from
Every figure below comes from a reimplementation of the core outside Pine, cross-checked against the live script on the same bar, and run over 3856 plotted bars of BINANCE:BTCUSDT and BINANCE:ETHUSDT 1H covering 3 March to 17 August 2026. The null draws use a seeded generator, so they reproduce. Warm-up discards the first 144 bars of each 4000-bar series.
🔹 The background will look like a barcode, and that is the result
These are per-bar labels drawn as bands, not regimes. Over 3856 bars at the defaults the label changes on 34.5% of BTCUSDT 1H bars, with a median unbroken run of 1 bar and a 90th percentile of 6. On ETHUSDT it is 38.0%, again a median run of 1 bar. Nothing here smooths that into looking more stable, because smoothing it would be the lie. The practical reading is blunt: on most bars this tells you nothing. Phase noise alone takes 59.2% of BTCUSDT bars, and the label changes on the next bar about one time in three - the median unbroken run is a single bar because short runs are common, not because most bars are isolated. Use it to look at a stretch of history, not to make a decision on the current bar.

BTCUSDT 1H at the shipped defaults, seven weeks. Three things to look at. The background is stripes rather than blocks, which is the 34.5% figure made visible. The C line - green above zero, pink below - stays well inside the two faint threshold lines at ±0.45 for almost the entire span; the handful of touches are some of the 8 episodes counted below. And the amber S* area is far wider than C, which is why the pane scales the way it does and why ω, wider still, is off by default.
What the bars get called, BTCUSDT / ETHUSDT: phase noise 59.2% / 51.7%, outward spiral 15.7% / 18.3%, inward spiral 13.6% / 16.8%, core 8.7% / 11.3%, phase slip 1.2% / 1.7%, orbital rotation 1.5% / 0.1%. Those last two are lower than the raw |C| rates below, because the cascade tests slip, core and spiral before it ever tests |C|.
🔹 The orbital-rotation verdict, and the null that kills it
The obvious null is to shuffle the second axis. That is the wrong null, and it is the mistake this script shipped with. Shuffling destroys y's autocorrelation as well as its alignment with x - lag-1 goes from 0.545 to 0.034 - and a y that jumps every bar inflates the total turning in the denominator, pushing C toward zero for reasons that have nothing to do with the two axes. A circular shift of y keeps the autocorrelation at 0.543 and breaks only the alignment, which is the thing under test.
Rate of the verdict against the p50 of each null over 20 draws, and p = the share of shift-null draws that match or beat the real rate. 3856 bars, both symbols:
Pine Script®
Read the shuffle and shift columns side by side. Against the shuffle the verdict looks like it separates at every window. Against the shift it separates at none: on BTCUSDT the real rate sits inside the bulk of its own null, and on ETHUSDT it sits below every draw. At the window this script originally shipped with, W = 24, the real rate is below the null median on both symbols.
The window was moved from 24 to 48 in an earlier cycle precisely because that drove the shuffle null to zero. What it actually did was widen a gap against a null that had been crippled. It stays at 48 as the more conservative reading, not because it separates anything.
And 71 and 11 are not 71 and 11 independent trials. Adjacent bars share 47 of their 48 turning angles. Counted as contiguous episodes, both symbols enter the state exactly 8 times; on BTCUSDT a single episode of 30 bars is 42% of every firing bar. The gap between the two symbols is how long one episode lasted.
🔹 Warm-up, alerts and cost
Nothing plots for 3 × the longest window, which now includes the consistency window - 144 bars at the defaults. Four alerts fire on entry into the phase-slip, outward-spiral and orbital-rotation states and on a change of rotation direction; they name the trigger and deliberately say nothing about what price should do next.
Four request.* calls sit at global scope and run every bar whatever the settings say; what is conditional is the timeframe each asks for, so the lower-timeframe pull only requests a real lower timeframe when the order-flow axis is selected. That is not the same as free, and the cost has not been measured. Two chart tabs did go unresponsive on a two-core machine during this work, one of them here during a symbol change - but the order-flow axis was afterwards exercised on 1H without incident and gave genuinely different values from the default. Read those as unexplained, not as a warning about a setting.
On the order-flow axis there is one silent substitution to know about: past the intrabar history limit, or on a plan that cannot serve the chosen lower timeframe, y falls back to the CLV proxy with no visible break, so the plotted history can mix two different second axes.
🔶 DETAILS
🔹 The construction
Both axes are z-scored over a rolling window and passed through a 2×2 whitening Σ^(-1/2), so a merely correlated pair does not draw a tilted ellipse and read as rotation. Turning per bar is the signed angle between successive position vectors, taken from the cross and dot products rather than by differencing φ, and spans inside a central dead zone count as zero turning because the angle there is noise. C is the ratio of the two rolling sums, gated so a window carrying less than π of total turning reports nothing at all.
🔹 The noise floor, measured honestly
Pine Script®
Break only the alignment and the level barely moves - and at the window this script originally shipped with, W = 24, it does not move at all: real 0.169 against a shift null of 0.167. Nearly everything you see is the random walk of a partial sum over 48 angles. The earlier "about seventy per cent" reading came from the shuffle column, and was therefore too generous to the indicator.
🔹 Which knobs are load-bearing
One. The lag on the second axis: with no lag, y is close to the derivative of x, the point circles for that reason alone, and median signed consistency comes back at -0.283 against -0.036 at the shipped lag of one bar. Two that are not: moving the dead zone from 0 to 1.0 moves median |C| from 0.144 to 0.128, and turning whitening off moves it from 0.133 to 0.138. Defensible hygiene, neither load-bearing.
🔹 What is not established
Incremental alpha, none of it - no IC against existing signals, no out-of-sample improvement, no PBO or DSR. This is an observer, and on the evidence above it is an observer of something it has not shown to be there. The experimental signal arrows are off by default and stay in only as a comparison: shuffling the second axis barely dented their performance, which points at the plain |x| threshold rather than at anything rotational.
🔶 SETTINGS
🔹 Axes and normalisation
🔹 Windows
🔹 Regimes and display
Radius, raw S*, phase-slip hazard, total turning, raw loop area, both axis positions and the regime number are in the Data Window.
Open source under the Mozilla Public License 2.0. Replications and refutations welcome - particularly a symbol, timeframe or axis pair on which the orbital-rotation state does separate from a shift null. I did not find one.
The verdict does not survive. Against a null that breaks only the thing being tested, the orbital-rotation state is not distinguishable from noise on BTCUSDT and is worse than noise on ETHUSDT. The numbers are below and the indicator ships with the state still labelled, because a label you can check is more useful than one quietly removed.
🔶 USAGE
🔹 What is in the pane
Two dimensionless series share one scale by design. C is the signed rotation consistency - net turning divided by total turning over a window, bounded to [-1, 1]. S* is a spiral index, tanh-compressed to the same range, positive when the trajectory winds outward. The bands behind them are the regime label; the dots along the top are phase slips.
Angular velocity ω is off by default, and that is a units decision rather than a judgement. C and S* are dimensionless; ω is rad/bar and reaches ‖ω‖ of 1.92 on BTCUSDT 1H against 0.597 for C and 0.768 for S*. Sharing an axis, it sets the scale and flattens the two series the pane exists to show. Turn it on and expect the pane to rescale.
🔹 Where the numbers come from
Every figure below comes from a reimplementation of the core outside Pine, cross-checked against the live script on the same bar, and run over 3856 plotted bars of BINANCE:BTCUSDT and BINANCE:ETHUSDT 1H covering 3 March to 17 August 2026. The null draws use a seeded generator, so they reproduce. Warm-up discards the first 144 bars of each 4000-bar series.
🔹 The background will look like a barcode, and that is the result
These are per-bar labels drawn as bands, not regimes. Over 3856 bars at the defaults the label changes on 34.5% of BTCUSDT 1H bars, with a median unbroken run of 1 bar and a 90th percentile of 6. On ETHUSDT it is 38.0%, again a median run of 1 bar. Nothing here smooths that into looking more stable, because smoothing it would be the lie. The practical reading is blunt: on most bars this tells you nothing. Phase noise alone takes 59.2% of BTCUSDT bars, and the label changes on the next bar about one time in three - the median unbroken run is a single bar because short runs are common, not because most bars are isolated. Use it to look at a stretch of history, not to make a decision on the current bar.
BTCUSDT 1H at the shipped defaults, seven weeks. Three things to look at. The background is stripes rather than blocks, which is the 34.5% figure made visible. The C line - green above zero, pink below - stays well inside the two faint threshold lines at ±0.45 for almost the entire span; the handful of touches are some of the 8 episodes counted below. And the amber S* area is far wider than C, which is why the pane scales the way it does and why ω, wider still, is off by default.
What the bars get called, BTCUSDT / ETHUSDT: phase noise 59.2% / 51.7%, outward spiral 15.7% / 18.3%, inward spiral 13.6% / 16.8%, core 8.7% / 11.3%, phase slip 1.2% / 1.7%, orbital rotation 1.5% / 0.1%. Those last two are lower than the raw |C| rates below, because the cascade tests slip, core and spiral before it ever tests |C|.
🔹 The orbital-rotation verdict, and the null that kills it
The obvious null is to shuffle the second axis. That is the wrong null, and it is the mistake this script shipped with. Shuffling destroys y's autocorrelation as well as its alignment with x - lag-1 goes from 0.545 to 0.034 - and a y that jumps every bar inflates the total turning in the denominator, pushing C toward zero for reasons that have nothing to do with the two axes. A circular shift of y keeps the autocorrelation at 0.543 and breaks only the alignment, which is the thing under test.
Rate of the verdict against the p50 of each null over 20 draws, and p = the share of shift-null draws that match or beat the real rate. 3856 bars, both symbols:
Read the shuffle and shift columns side by side. Against the shuffle the verdict looks like it separates at every window. Against the shift it separates at none: on BTCUSDT the real rate sits inside the bulk of its own null, and on ETHUSDT it sits below every draw. At the window this script originally shipped with, W = 24, the real rate is below the null median on both symbols.
The window was moved from 24 to 48 in an earlier cycle precisely because that drove the shuffle null to zero. What it actually did was widen a gap against a null that had been crippled. It stays at 48 as the more conservative reading, not because it separates anything.
And 71 and 11 are not 71 and 11 independent trials. Adjacent bars share 47 of their 48 turning angles. Counted as contiguous episodes, both symbols enter the state exactly 8 times; on BTCUSDT a single episode of 30 bars is 42% of every firing bar. The gap between the two symbols is how long one episode lasted.
🔹 Warm-up, alerts and cost
Nothing plots for 3 × the longest window, which now includes the consistency window - 144 bars at the defaults. Four alerts fire on entry into the phase-slip, outward-spiral and orbital-rotation states and on a change of rotation direction; they name the trigger and deliberately say nothing about what price should do next.
Four request.* calls sit at global scope and run every bar whatever the settings say; what is conditional is the timeframe each asks for, so the lower-timeframe pull only requests a real lower timeframe when the order-flow axis is selected. That is not the same as free, and the cost has not been measured. Two chart tabs did go unresponsive on a two-core machine during this work, one of them here during a symbol change - but the order-flow axis was afterwards exercised on 1H without incident and gave genuinely different values from the default. Read those as unexplained, not as a warning about a setting.
On the order-flow axis there is one silent substitution to know about: past the intrabar history limit, or on a plan that cannot serve the chosen lower timeframe, y falls back to the CLV proxy with no visible break, so the plotted history can mix two different second axes.
🔶 DETAILS
🔹 The construction
Both axes are z-scored over a rolling window and passed through a 2×2 whitening Σ^(-1/2), so a merely correlated pair does not draw a tilted ellipse and read as rotation. Turning per bar is the signed angle between successive position vectors, taken from the cross and dot products rather than by differencing φ, and spans inside a central dead zone count as zero turning because the angle there is noise. C is the ratio of the two rolling sums, gated so a window carrying less than π of total turning reports nothing at all.
🔹 The noise floor, measured honestly
Break only the alignment and the level barely moves - and at the window this script originally shipped with, W = 24, it does not move at all: real 0.169 against a shift null of 0.167. Nearly everything you see is the random walk of a partial sum over 48 angles. The earlier "about seventy per cent" reading came from the shuffle column, and was therefore too generous to the indicator.
🔹 Which knobs are load-bearing
One. The lag on the second axis: with no lag, y is close to the derivative of x, the point circles for that reason alone, and median signed consistency comes back at -0.283 against -0.036 at the shipped lag of one bar. Two that are not: moving the dead zone from 0 to 1.0 moves median |C| from 0.144 to 0.128, and turning whitening off moves it from 0.133 to 0.138. Defensible hygiene, neither load-bearing.
🔹 What is not established
Incremental alpha, none of it - no IC against existing signals, no out-of-sample improvement, no PBO or DSR. This is an observer, and on the evidence above it is an observer of something it has not shown to be there. The experimental signal arrows are off by default and stay in only as a comparison: shuffling the second axis barely dented their performance, which points at the plain |x| threshold rather than at anything rotational.
🔶 SETTINGS
🔹 Axes and normalisation
- Second axis y - five options: deviation × momentum (default), deviation × order flow from lower-timeframe volume delta, deviation × order flow via a CLV × volume proxy, return × volatility change, and deviation × open-interest change. Momentum is close to the derivative of x, so read the default as the control rather than as the best proxy. Every number in this description is measured on that default axis, deliberately - it is the weakest case, and a statistic that cannot beat its null there has not earned a test on a better axis. The order-flow axis was not re-measured.
- Lag on the second axis - default 1. The one setting that decides whether the measurement means anything.
- Equilibrium EMA 34, z-score length 40, 2×2 whitening on, z clip 4.0, optional anchored normalisation.
🔹 Windows
- Consistency window for C - default 48. Read the window sweep above before changing it - no setting of it separates the verdict from the shift null.
- Total-turning gate - default π. Below it, C and S* report na rather than a ratio of two small numbers. It is a safeguard that never bound on the data here: total turning had a median of 27.7 rad and a minimum of 12.6 against a gate of 3.14, so it was open on all 3856 bars of both symbols. Expect no gaps from it.
- Central dead zone 0.30, winding window 32, loop-area window 24, warm-up multiplier 3.
🔹 Regimes and display
- Thresholds for orbital rotation, spiral, core radius and phase-slip hazard.
- C, S*, the regime background and the slip markers are on by default; ω, winding number W, loop area A, the Kuramoto multi-timeframe readout and the experimental arrows are off.
- The Kuramoto readout R carries the same units caveat as ω: it lives on [0, 1] and is positive only, so switching it on rescales the pane. It is drawn beneath C so it cannot hide it. Its two higher timeframes now default to 4H and 12H - they were 1H and 4H, and on the shipped 1H chart that made two of the three phases identical and put a floor of 1/3 under R. Keep both above your chart timeframe.
Radius, raw S*, phase-slip hazard, total turning, raw loop area, both axis positions and the regime number are in the Data Window.
Open source under the Mozilla Public License 2.0. Replications and refutations welcome - particularly a symbol, timeframe or axis pair on which the orbital-rotation state does separate from a shift null. I did not find one.

FibonacciFlux: Pushing indicator boundaries. Crafting sophisticated, surprising tools via ambitious R&D.
Отказ от ответственности
Информация и публикации не предназначены для предоставления и не являются финансовыми, инвестиционными, торговыми или другими видами советов или рекомендаций, предоставленных или одобренных TradingView. Подробнее читайте в Условиях использования.
FibonacciFlux: Pushing indicator boundaries. Crafting sophisticated, surprising tools via ambitious R&D.
Отказ от ответственности
Информация и публикации не предназначены для предоставления и не являются финансовыми, инвестиционными, торговыми или другими видами советов или рекомендаций, предоставленных или одобренных TradingView. Подробнее читайте в Условиях использования.