OPEN-SOURCE SCRIPT
[SW Lab] Signal Decay Monitor
## What It Does
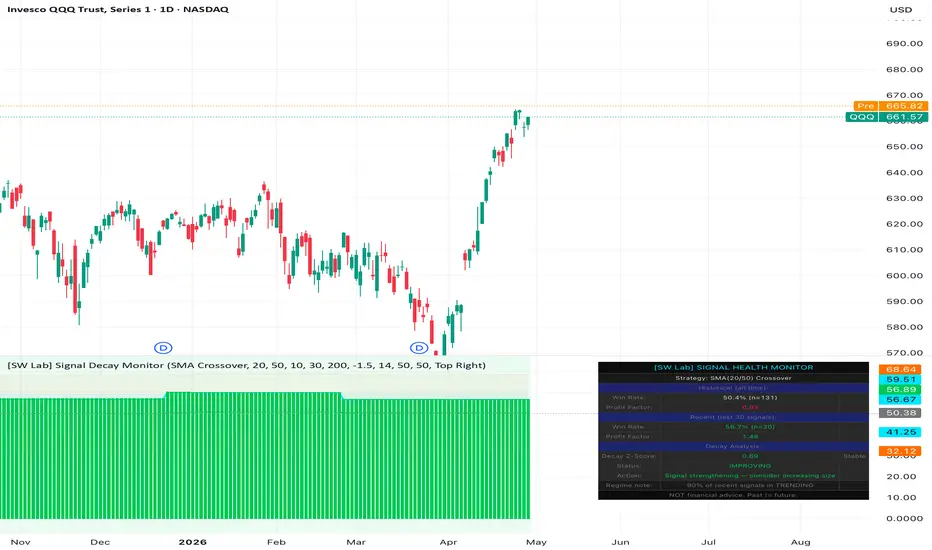
Every trading signal has a shelf life. A strategy that delivered strong returns for six months can quietly stop working as markets adapt -- and most traders only notice after weeks of losses. The Signal Decay Monitor uses a statistical Z-test to continuously compare a strategy's recent performance against its historical baseline, flagging degradation before your P&L does.
## How It Works
- Select any of 6 built-in strategies (SMA Crossover, RSI Reversal, MACD Signal, Bollinger Bounce, Breakout, Mean Reversion) and the indicator tracks every signal and its forward return
- Computes a rolling win rate over a configurable recent window (default: last 30 evaluated signals) and compares it to the full historical win rate
- Performs a Z-test to determine whether the difference between recent and historical performance is statistically significant or just normal variance
- Plots confidence bands (1-sigma and 2-sigma) around the historical baseline so you can visually distinguish meaningful decay from noise
- Tracks which market regime recent signals occurred in, helping you determine if the strategy failed or if the regime simply shifted
## Key Features
- **Rolling win rate oscillator** (cyan line) showing recent signal performance in real time
- **Historical baseline** (gray line) for long-term average win rate reference
- **1-sigma and 2-sigma confidence bands** showing expected statistical variation
- **Z-score histogram** providing a visual representation of the decay score
- **Background color changes** with health status for instant visual assessment
- **Regime analysis** in the info panel identifying whether losses concentrate in a specific regime
- **Info panel** with complete breakdown: health status, Z-score, recent vs. historical win rate, signal counts, and regime notes
## Signal Interpretation
| Health Status | Z-Score Range | Meaning | Recommended Action |
|--------------|---------------|---------|-------------------|
| HEALTHY | Z > -0.5 | Edge intact | Trade normally |
| IMPROVING | Z > +0.5 | Signal getting stronger | Consider increasing size |
| WEAKENING | -0.5 to -1.5 | Early warning | Monitor closely, tighten stops |
| DEGRADING | -1.5 to -2.5 | Significant decay detected | Reduce position size |
| DEAD | Z < -2.5 | Edge is gone | Stop trading this signal |
| NEVER PROFITABLE | N/A | Strategy never had an edge | Do not trade on this asset |
## Settings Guide
| Parameter | Default | Description |
|-----------|---------|-------------|
| Strategy | SMA Crossover | Which strategy's signal health to monitor |
| Fast Length | 20 | Primary period for the selected strategy |
| Slow Length | 50 | Secondary period for the selected strategy |
| Recent Window | 30 | Number of recent evaluated signals to compare against baseline |
| Historical Window | 200 | Full history lookback for baseline performance |
| Evaluation Bars | 10 | Forward bars to measure each signal outcome |
| Decay Threshold | -1.5 | Z-score below which health is flagged as decaying |
| ATR Fast / Slow | 14 / 50 | ATR periods for regime detection |
| Trend Length | 50 | SMA period for trend slope calculation |
## Alerts
- Decay detected (Z-score crosses below the configured threshold)
- Signal declared DEAD (Z-score falls below -2.5)
- Signal IMPROVING (Z-score rises above +0.5)
## Best Used For
- Monitoring live strategies for performance degradation before losses accumulate
- Deciding when to retire a signal that has lost its edge
- Distinguishing between a strategy that stopped working and a strategy in a temporarily unfavorable regime
- Validating whether a recently discovered setup maintains its edge over time
- Companion tool to the Backtest Truth Table -- use the Truth Table to find edges, the Decay Monitor to track when they expire
## Academic Foundation
The decay detection is based on a standard two-proportion Z-test, comparing the recent win rate proportion against the historical baseline proportion. This is a well-established statistical hypothesis test used to determine whether observed differences are significant or attributable to sampling noise.
## Disclaimer
This indicator is an analytical tool, not financial advice. Past statistical performance does not guarantee future results. Always apply your own risk management.
Every trading signal has a shelf life. A strategy that delivered strong returns for six months can quietly stop working as markets adapt -- and most traders only notice after weeks of losses. The Signal Decay Monitor uses a statistical Z-test to continuously compare a strategy's recent performance against its historical baseline, flagging degradation before your P&L does.
## How It Works
- Select any of 6 built-in strategies (SMA Crossover, RSI Reversal, MACD Signal, Bollinger Bounce, Breakout, Mean Reversion) and the indicator tracks every signal and its forward return
- Computes a rolling win rate over a configurable recent window (default: last 30 evaluated signals) and compares it to the full historical win rate
- Performs a Z-test to determine whether the difference between recent and historical performance is statistically significant or just normal variance
- Plots confidence bands (1-sigma and 2-sigma) around the historical baseline so you can visually distinguish meaningful decay from noise
- Tracks which market regime recent signals occurred in, helping you determine if the strategy failed or if the regime simply shifted
## Key Features
- **Rolling win rate oscillator** (cyan line) showing recent signal performance in real time
- **Historical baseline** (gray line) for long-term average win rate reference
- **1-sigma and 2-sigma confidence bands** showing expected statistical variation
- **Z-score histogram** providing a visual representation of the decay score
- **Background color changes** with health status for instant visual assessment
- **Regime analysis** in the info panel identifying whether losses concentrate in a specific regime
- **Info panel** with complete breakdown: health status, Z-score, recent vs. historical win rate, signal counts, and regime notes
## Signal Interpretation
| Health Status | Z-Score Range | Meaning | Recommended Action |
|--------------|---------------|---------|-------------------|
| HEALTHY | Z > -0.5 | Edge intact | Trade normally |
| IMPROVING | Z > +0.5 | Signal getting stronger | Consider increasing size |
| WEAKENING | -0.5 to -1.5 | Early warning | Monitor closely, tighten stops |
| DEGRADING | -1.5 to -2.5 | Significant decay detected | Reduce position size |
| DEAD | Z < -2.5 | Edge is gone | Stop trading this signal |
| NEVER PROFITABLE | N/A | Strategy never had an edge | Do not trade on this asset |
## Settings Guide
| Parameter | Default | Description |
|-----------|---------|-------------|
| Strategy | SMA Crossover | Which strategy's signal health to monitor |
| Fast Length | 20 | Primary period for the selected strategy |
| Slow Length | 50 | Secondary period for the selected strategy |
| Recent Window | 30 | Number of recent evaluated signals to compare against baseline |
| Historical Window | 200 | Full history lookback for baseline performance |
| Evaluation Bars | 10 | Forward bars to measure each signal outcome |
| Decay Threshold | -1.5 | Z-score below which health is flagged as decaying |
| ATR Fast / Slow | 14 / 50 | ATR periods for regime detection |
| Trend Length | 50 | SMA period for trend slope calculation |
## Alerts
- Decay detected (Z-score crosses below the configured threshold)
- Signal declared DEAD (Z-score falls below -2.5)
- Signal IMPROVING (Z-score rises above +0.5)
## Best Used For
- Monitoring live strategies for performance degradation before losses accumulate
- Deciding when to retire a signal that has lost its edge
- Distinguishing between a strategy that stopped working and a strategy in a temporarily unfavorable regime
- Validating whether a recently discovered setup maintains its edge over time
- Companion tool to the Backtest Truth Table -- use the Truth Table to find edges, the Decay Monitor to track when they expire
## Academic Foundation
The decay detection is based on a standard two-proportion Z-test, comparing the recent win rate proportion against the historical baseline proportion. This is a well-established statistical hypothesis test used to determine whether observed differences are significant or attributable to sampling noise.
## Disclaimer
This indicator is an analytical tool, not financial advice. Past statistical performance does not guarantee future results. Always apply your own risk management.
Скрипт с открытым кодом
В истинном духе TradingView, создатель этого скрипта сделал его открытым исходным кодом, чтобы трейдеры могли проверить и убедиться в его функциональности. Браво автору! Вы можете использовать его бесплатно, но помните, что перепубликация кода подчиняется нашим Правилам поведения.

Отказ от ответственности
Информация и публикации не предназначены для предоставления и не являются финансовыми, инвестиционными, торговыми или другими видами советов или рекомендаций, предоставленных или одобренных TradingView. Подробнее читайте в Условиях использования.
Скрипт с открытым кодом
В истинном духе TradingView, создатель этого скрипта сделал его открытым исходным кодом, чтобы трейдеры могли проверить и убедиться в его функциональности. Браво автору! Вы можете использовать его бесплатно, но помните, что перепубликация кода подчиняется нашим Правилам поведения.
Отказ от ответственности
Информация и публикации не предназначены для предоставления и не являются финансовыми, инвестиционными, торговыми или другими видами советов или рекомендаций, предоставленных или одобренных TradingView. Подробнее читайте в Условиях использования.