Обновлено
Option Positions
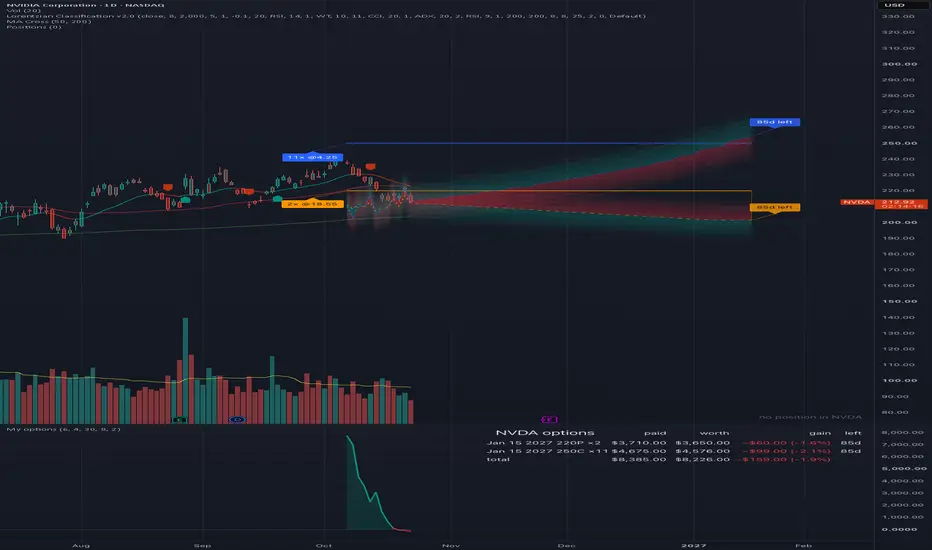
Shows your own option positions on the chart and how they are doing.
What it does
• A pane under the chart with the real gain or loss of your options on this symbol over time, from each contract's own price history.
• On the price chart: the strike as a solid line, a buy mark for every purchase, and an expiry tag with days left.
• A dashed "money-back" line: the price at which selling the option would return what you paid. From the purchase day to today it is real history, computed from each day's actual contract price. From today to expiry it is a model (Black-Scholes at the volatility implied by today's price, held fixed), so it bends toward the exact expiry level as time value melts.
• A table with paid, worth, gain and days left for each position.
• On SPX, XAUUSD and XAGUSD charts it shows your SPY, GLD, SLV and SIL options with levels converted into the index or metal price.
How to use it
Open Settings and paste your positions into the "Option positions" box, one per line:
TICKER, purchase date YYYYMMDD, contracts, price paid per share, strike, C or P, expiry YYYYMMDD, dollars paid in total
Example: GLD,20260902,10,3.20,300,P,20261218,3200
Every chart shows only the positions on its own symbol.
If you use the indicator on many charts, you can instead put the positions into the code: make a copy of the script, paste the same positions as one line into OPTION_POSITIONS at the top of the source (positions separated by semicolons), and save. That one line then feeds every chart the copy is on, and you only edit the code when a position changes. The settings box wins when it has text, so leave it empty on those charts.
Limits
Needs a TradingView plan that serves US option contract prices (OPRA). The modeled part of the money-back curve assumes volatility stays where it is today and ignores dividends; worth and gain never use the model, only real prices. Expired contracts are hidden by default.
What it does
• A pane under the chart with the real gain or loss of your options on this symbol over time, from each contract's own price history.
• On the price chart: the strike as a solid line, a buy mark for every purchase, and an expiry tag with days left.
• A dashed "money-back" line: the price at which selling the option would return what you paid. From the purchase day to today it is real history, computed from each day's actual contract price. From today to expiry it is a model (Black-Scholes at the volatility implied by today's price, held fixed), so it bends toward the exact expiry level as time value melts.
• A table with paid, worth, gain and days left for each position.
• On SPX, XAUUSD and XAGUSD charts it shows your SPY, GLD, SLV and SIL options with levels converted into the index or metal price.
How to use it
Open Settings and paste your positions into the "Option positions" box, one per line:
TICKER, purchase date YYYYMMDD, contracts, price paid per share, strike, C or P, expiry YYYYMMDD, dollars paid in total
Example: GLD,20260902,10,3.20,300,P,20261218,3200
Every chart shows only the positions on its own symbol.
If you use the indicator on many charts, you can instead put the positions into the code: make a copy of the script, paste the same positions as one line into OPTION_POSITIONS at the top of the source (positions separated by semicolons), and save. That one line then feeds every chart the copy is on, and you only edit the code when a position changes. The settings box wins when it has text, so leave it empty on those charts.
Limits
Needs a TradingView plan that serves US option contract prices (OPRA). The modeled part of the money-back curve assumes volatility stays where it is today and ignores dividends; worth and gain never use the model, only real prices. Expired contracts are hidden by default.
Информация о релизе
No change to behavior. This version adds the chart notes that the description should have carried.Index and metal charts
Some charts show options on a fund that stands in for them, with every level converted into the chart's own price:
• SPX, US500 and ES1! show your SPY options. A SPY 580 put appears at about 5,800 on SPX.
• XAUUSD and GOLD show your GLD and IAU options.
• XAGUSD and SILVER show your SLV, SIL and PSLV options.
Funds that hold the index or the metal (SPY, GLD, IAU, SLV, PSLV) are converted by their price ratio to the chart, which is fixed to a fraction of a percent. Mining funds (SIL) have no fixed ratio, so the script measures over the last year how much the fund moves per 1% move of the metal and converts through that; those levels are approximate and are redrawn from today's prices every day. On these charts each fund gets its own color, set in Settings, and the tooltips give both levels, for example "300.00 on GLD ≈ 3,240.00 gold". Every other chart simply shows the options on its own symbol. To add a chart or a fund, copy the script and edit the LEVER_MAP line near the top.
Positions in the code
If you use the indicator on many charts, you can put the positions into the code instead of the settings box: copy the script, paste the positions as one line into OPTION_POSITIONS at the top, save. The settings box wins when it has text.
Информация о релизе
Added gradients to the profit/loss side of the breakeven lines.Информация о релизе
Fix: wrong curve on intraday chartsOn hourly and other intraday charts the money-back history was computed every bar, pairing the current stock price with the previous day's contract price. That made the curve and its shading spike. The history now runs once per completed day on every timeframe, from the day's stock close and the day's contract close, so an hourly chart shows the same curve as the daily chart, with one point per day. The ratio and slope used on the SPX, gold and silver charts are now measured in days as well: the last 20 days and the last 250 days, whatever the timeframe.
Unchanged
Strike lines, buy marks, expiry tags, the table and the gain pane. The "Badge shift sideways, in bars" setting still counts the chart's own bars.
Информация о релизе
Fixed chart
Отказ от ответственности
Информация и публикации не предназначены для предоставления и не являются финансовыми, инвестиционными, торговыми или другими видами советов или рекомендаций, предоставленных или одобренных TradingView. Подробнее читайте в Условиях использования.
Отказ от ответственности
Информация и публикации не предназначены для предоставления и не являются финансовыми, инвестиционными, торговыми или другими видами советов или рекомендаций, предоставленных или одобренных TradingView. Подробнее читайте в Условиях использования.