ICT Swing Failure Pattern [vole]
OVERVIEW
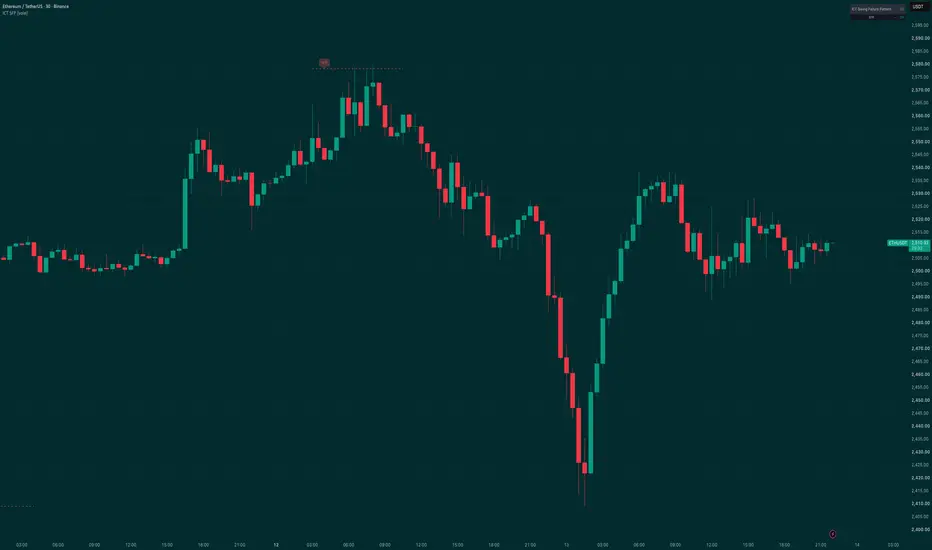
ICT Swing Failure Pattern marks the bar on which a wick goes through the latest swing high or swing low and the candle closes back inside it. The break did not hold. By default only patterns against the current market bias are shown: a bearish pattern in a bullish market and a bullish pattern in a bearish market.
HOW IT WORKS
The indicator finds swings and tracks a market bias from breaks of structure. On every bar it compares the high and low with the latest swing high and swing low. A bearish pattern is a bar whose high goes above the latest swing high while its close stays below that swing high, with the upper wick taking at least a chosen share of the candle's range. A bullish pattern is the mirror at the swing low. With the default trend filter, a bearish pattern is shown only while the bias is bullish, and a bullish pattern only while the bias is bearish. A horizontal line at the swing level extends to the right of each pattern, and a limited number of markers are kept on the chart.

Bullish and bearish patterns on a 15-minute chart. Each dashed line marks the swing level that failed.
WHAT YOU'LL SEE ON THE CHART

A bearish pattern on a 30-minute chart: a bar wicks above the latest swing high and closes back below it.
BEST FOR
This indicator draws and labels price structure rather than reporting a single event type, so no market or timeframe group is singled out. It was not measured, and it reads the candles of whatever chart it is placed on.
ALERTS
LIMITATIONS
The script reads the candles of the chart it is placed on, so results on non-standard chart types differ from results on regular candles. Swing points are known only after the chosen number of bars has passed, so swing-based items appear with that delay. It is a drawing and labelling tool, not a forecast. It is weaker in these situations:
OPEN SOURCE
The source code is open. This script is one module of the author's own larger ICT toolkit, published here on its own so it can be read, checked and reused under the Mozilla Public License 2.0.
ACCESS
Free, open-source script.
DISCLAIMER
This indicator is a technical analysis tool, not investment advice. The author is not a registered investment adviser, broker or dealer. Nothing here is a recommendation to buy, sell or hold any instrument. What you see on the chart is the output of a calculation you configured. Any decision you take from it is yours. Past behaviour of an indicator — including anything you observe in historical bars or in a backtest, which is a simulation — does not indicate future results. Trading carries a real risk of loss, including your entire capital. Charting uses TradingView® technology. TradingView is unaffiliated with the author. For educational purposes only. Not investment advice.
ICT Swing Failure Pattern marks the bar on which a wick goes through the latest swing high or swing low and the candle closes back inside it. The break did not hold. By default only patterns against the current market bias are shown: a bearish pattern in a bullish market and a bullish pattern in a bearish market.
HOW IT WORKS
The indicator finds swings and tracks a market bias from breaks of structure. On every bar it compares the high and low with the latest swing high and swing low. A bearish pattern is a bar whose high goes above the latest swing high while its close stays below that swing high, with the upper wick taking at least a chosen share of the candle's range. A bullish pattern is the mirror at the swing low. With the default trend filter, a bearish pattern is shown only while the bias is bullish, and a bullish pattern only while the bias is bearish. A horizontal line at the swing level extends to the right of each pattern, and a limited number of markers are kept on the chart.
Bullish and bearish patterns on a 15-minute chart. Each dashed line marks the swing level that failed.
WHAT YOU'LL SEE ON THE CHART
- SFP markers — a label on the bar of the pattern, below the bar for a bullish pattern and above the bar for a bearish pattern.
- SFP level line — a short horizontal line at the swing level the pattern formed on.
- Dashboard — a small table showing whether a pattern fired on the latest bar.
A bearish pattern on a 30-minute chart: a bar wicks above the latest swing high and closes back below it.
BEST FOR
This indicator draws and labels price structure rather than reporting a single event type, so no market or timeframe group is singled out. It was not measured, and it reads the candles of whatever chart it is placed on.
ALERTS
- Bullish SFP
- Bearish SFP
- Any SFP
LIMITATIONS
The script reads the candles of the chart it is placed on, so results on non-standard chart types differ from results on regular candles. Swing points are known only after the chosen number of bars has passed, so swing-based items appear with that delay. It is a drawing and labelling tool, not a forecast. It is weaker in these situations:
- Strong trends, where swing levels are broken for good
- Choppy markets, where small swings are probed constantly
- Early in a chart, before swings and bias are established
- Intrabar use, since a marker can disappear before the bar closes
OPEN SOURCE
The source code is open. This script is one module of the author's own larger ICT toolkit, published here on its own so it can be read, checked and reused under the Mozilla Public License 2.0.
ACCESS
Free, open-source script.
DISCLAIMER
This indicator is a technical analysis tool, not investment advice. The author is not a registered investment adviser, broker or dealer. Nothing here is a recommendation to buy, sell or hold any instrument. What you see on the chart is the output of a calculation you configured. Any decision you take from it is yours. Past behaviour of an indicator — including anything you observe in historical bars or in a backtest, which is a simulation — does not indicate future results. Trading carries a real risk of loss, including your entire capital. Charting uses TradingView® technology. TradingView is unaffiliated with the author. For educational purposes only. Not investment advice.

volebot — technical-analysis indicators with plain-language docs. Access requests and contact: vole.bot
Отказ от ответственности
Информация и публикации не предназначены для предоставления и не являются финансовыми, инвестиционными, торговыми или другими видами советов или рекомендаций, предоставленных или одобренных TradingView. Подробнее читайте в Условиях использования.
Отказ от ответственности
Информация и публикации не предназначены для предоставления и не являются финансовыми, инвестиционными, торговыми или другими видами советов или рекомендаций, предоставленных или одобренных TradingView. Подробнее читайте в Условиях использования.