OPEN-SOURCE SCRIPT
Divergence Map [FEELS]
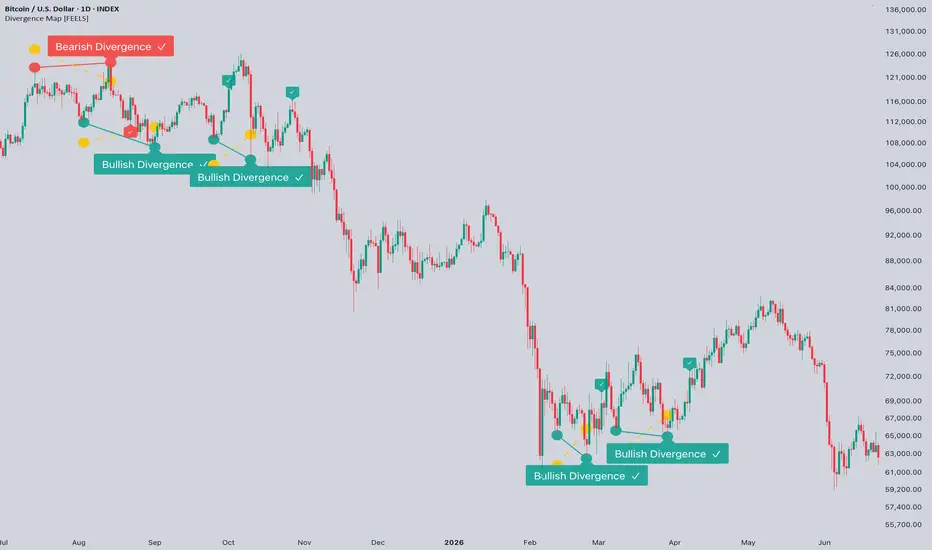
Price up, strength not.
Divergence Map marks every spot where price made a new high or low but the volume delta behind it didn't agree. Across the whole chart, not just the right edge.

OVERVIEW
Each divergence is drawn as a pair of crossing lines on the price pane: the line through the two price swings, and a second line whose opening reflects the volume delta behind those swings, widening in proportion to the strength gap so the disagreement is visible at a glance. A new high with weaker delta is marked at the top, a new low with weaker selling is marked at the bottom. Most divergence tools push a delta line into a separate panel and leave you to eyeball the slopes; this keeps the comparison on price, as one shape, for the whole chart.
HOW IT WORKS
1. Per-bar delta uses the standard bar-direction proxy: a bar closing up counts its volume as positive, a bar closing down as negative, a flat bar as zero. These are summed into a cumulative volume delta. Pine has no true tick order flow on historical bars, so this proxy is what the calculation is built on, and the logic is designed around its limits.
2. The cumulative delta is measured against its own recent trend (its value minus a moving average of itself), so divergences are read against recent flow rather than the all-time drift of a running total.
3. Swing highs and lows are found with a symmetric pivot of configurable length. A swing is used only once it is confirmed by that many closed bars on each side.
4. A top divergence is recorded when a confirmed swing high is above the previous swing high while the trend-adjusted delta at the new swing sits below its reading at the previous one. A bottom divergence is the mirror. The test compares the relative direction of delta between two swings rather than an absolute value, which is what lets it tolerate the proxy.
5. Strength is the size of that delta gap, scaled by its recent range and reported 0 to 100. A minimum-strength input hides weak readings.
6. Each divergence is then tracked for an outcome. By default it is scored from the bar it actually becomes visible (one swing length after the swing, since a swing cannot be known before then), and judged symmetrically from there: whichever comes first within the window, a reversal of the set size in its direction is a check, the same move against it is a cross. The size is taken from volatility by default (a multiple of ATR), so it scales with the timeframe; it can be switched to a fixed percent. An event also fails if price closes back through the swing that defined it. This removes the look-back head start, so the hit rate in the dashboard is descriptive of how these divergences have actually behaved, not a promise about the next one.

HOW TO USE
- Read the shape, not a number. Two lines opening apart at a top means price rose while delta did not; at a bottom, price fell while selling did not.
- The check or cross on each past event shows whether the expected reversal followed, so the chart carries its own record on the symbol and timeframe you are viewing.
- During a strong, clean trend the map stays mostly empty. That is expected: divergences appear at exhaustion, not inside a healthy trend.
- Raise minimum strength to keep only the clearer events. Swing length sets how major the marked swings are. Reversal percent and window define what counts as a resolved reversal. Turn off Remove swing lag to see the look-back figure instead of the real-time one.

PARAMETERS
- Swing length: bars per side to confirm a swing.
- Min strength: hides divergences below this 0 to 100 score.
- Delta smoothing and strength window: detrend the delta and scale the strength score.
- ATR reversal and Reversal ATR: size the reversal by volatility so the threshold scales with the timeframe (about 5% daily, around 15% weekly); turn off to use the fixed Reversal percent.
- Reversal percent and reversal window: the fixed-percent threshold and the bars allowed for a resolved reversal.
- Remove swing lag: scores each event from the bar it becomes visible and judges it symmetrically, giving a realistic hit rate instead of the look-back one.
- Labels, label and dot size, line width, colors, strength line on or off, mark hit on chart, dashboard position.
REPAINT NOTE
A swing is confirmed one swing length after it forms, which is how pivots work, and a divergence is recorded only on closed bars using that confirmed swing. Once a divergence and its lines are drawn they do not move, and the check or cross is added later on closed bars as the outcome settles. The only live element is the dashboard. No higher-timeframe or external data requests are used.
ORIGINALITY
This is original work and the source is open. It is not a wrapper around a built-in oscillator and it does not plot delta in a separate pane. The comparison is kept on the price pane as one crossing shape, applied across full history, with a built-in record of whether each marked divergence was followed by a reversal, scored from the bar it actually became visible. The honest treatment of the delta proxy, comparing relative slope rather than absolute flow, is part of the design.
Descriptive tool for studying divergence behaviour. It is not financial advice and does not predict price.
Divergence Map marks every spot where price made a new high or low but the volume delta behind it didn't agree. Across the whole chart, not just the right edge.
OVERVIEW
Each divergence is drawn as a pair of crossing lines on the price pane: the line through the two price swings, and a second line whose opening reflects the volume delta behind those swings, widening in proportion to the strength gap so the disagreement is visible at a glance. A new high with weaker delta is marked at the top, a new low with weaker selling is marked at the bottom. Most divergence tools push a delta line into a separate panel and leave you to eyeball the slopes; this keeps the comparison on price, as one shape, for the whole chart.
HOW IT WORKS
1. Per-bar delta uses the standard bar-direction proxy: a bar closing up counts its volume as positive, a bar closing down as negative, a flat bar as zero. These are summed into a cumulative volume delta. Pine has no true tick order flow on historical bars, so this proxy is what the calculation is built on, and the logic is designed around its limits.
2. The cumulative delta is measured against its own recent trend (its value minus a moving average of itself), so divergences are read against recent flow rather than the all-time drift of a running total.
3. Swing highs and lows are found with a symmetric pivot of configurable length. A swing is used only once it is confirmed by that many closed bars on each side.
4. A top divergence is recorded when a confirmed swing high is above the previous swing high while the trend-adjusted delta at the new swing sits below its reading at the previous one. A bottom divergence is the mirror. The test compares the relative direction of delta between two swings rather than an absolute value, which is what lets it tolerate the proxy.
5. Strength is the size of that delta gap, scaled by its recent range and reported 0 to 100. A minimum-strength input hides weak readings.
6. Each divergence is then tracked for an outcome. By default it is scored from the bar it actually becomes visible (one swing length after the swing, since a swing cannot be known before then), and judged symmetrically from there: whichever comes first within the window, a reversal of the set size in its direction is a check, the same move against it is a cross. The size is taken from volatility by default (a multiple of ATR), so it scales with the timeframe; it can be switched to a fixed percent. An event also fails if price closes back through the swing that defined it. This removes the look-back head start, so the hit rate in the dashboard is descriptive of how these divergences have actually behaved, not a promise about the next one.
HOW TO USE
- Read the shape, not a number. Two lines opening apart at a top means price rose while delta did not; at a bottom, price fell while selling did not.
- The check or cross on each past event shows whether the expected reversal followed, so the chart carries its own record on the symbol and timeframe you are viewing.
- During a strong, clean trend the map stays mostly empty. That is expected: divergences appear at exhaustion, not inside a healthy trend.
- Raise minimum strength to keep only the clearer events. Swing length sets how major the marked swings are. Reversal percent and window define what counts as a resolved reversal. Turn off Remove swing lag to see the look-back figure instead of the real-time one.
PARAMETERS
- Swing length: bars per side to confirm a swing.
- Min strength: hides divergences below this 0 to 100 score.
- Delta smoothing and strength window: detrend the delta and scale the strength score.
- ATR reversal and Reversal ATR: size the reversal by volatility so the threshold scales with the timeframe (about 5% daily, around 15% weekly); turn off to use the fixed Reversal percent.
- Reversal percent and reversal window: the fixed-percent threshold and the bars allowed for a resolved reversal.
- Remove swing lag: scores each event from the bar it becomes visible and judges it symmetrically, giving a realistic hit rate instead of the look-back one.
- Labels, label and dot size, line width, colors, strength line on or off, mark hit on chart, dashboard position.
REPAINT NOTE
A swing is confirmed one swing length after it forms, which is how pivots work, and a divergence is recorded only on closed bars using that confirmed swing. Once a divergence and its lines are drawn they do not move, and the check or cross is added later on closed bars as the outcome settles. The only live element is the dashboard. No higher-timeframe or external data requests are used.
ORIGINALITY
This is original work and the source is open. It is not a wrapper around a built-in oscillator and it does not plot delta in a separate pane. The comparison is kept on the price pane as one crossing shape, applied across full history, with a built-in record of whether each marked divergence was followed by a reversal, scored from the bar it actually became visible. The honest treatment of the delta proxy, comparing relative slope rather than absolute flow, is part of the design.
Descriptive tool for studying divergence behaviour. It is not financial advice and does not predict price.
Скрипт с открытым кодом
В истинном духе TradingView, создатель этого скрипта сделал его открытым исходным кодом, чтобы трейдеры могли проверить и убедиться в его функциональности. Браво автору! Вы можете использовать его бесплатно, но помните, что перепубликация кода подчиняется нашим Правилам поведения.

💰Free Channel — t.me/FeelsStrategy
🤵For more info contact — t.me/VolodymyrFeels
🔗 Links — feelsstrategy.com/links
🤵For more info contact — t.me/VolodymyrFeels
🔗 Links — feelsstrategy.com/links
Отказ от ответственности
Информация и публикации не предназначены для предоставления и не являются финансовыми, инвестиционными, торговыми или другими видами советов или рекомендаций, предоставленных или одобренных TradingView. Подробнее читайте в Условиях использования.
Скрипт с открытым кодом
В истинном духе TradingView, создатель этого скрипта сделал его открытым исходным кодом, чтобы трейдеры могли проверить и убедиться в его функциональности. Браво автору! Вы можете использовать его бесплатно, но помните, что перепубликация кода подчиняется нашим Правилам поведения.
💰Free Channel — t.me/FeelsStrategy
🤵For more info contact — t.me/VolodymyrFeels
🔗 Links — feelsstrategy.com/links
🤵For more info contact — t.me/VolodymyrFeels
🔗 Links — feelsstrategy.com/links
Отказ от ответственности
Информация и публикации не предназначены для предоставления и не являются финансовыми, инвестиционными, торговыми или другими видами советов или рекомендаций, предоставленных или одобренных TradingView. Подробнее читайте в Условиях использования.