OPEN-SOURCE SCRIPT
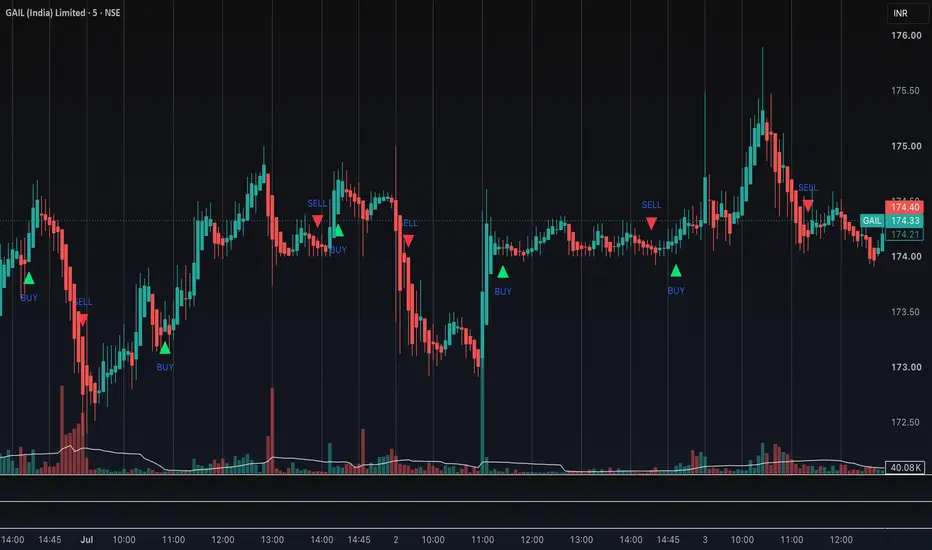
Hilega-Milega BUY SELL Signals
# Hilega-Milega BUY SELL Signals
## Overview
Hilega-Milega BUY SELL Signals is a momentum-based indicator built on the Relative Strength Index (RSI). It combines the RSI with a fast Exponential Moving Average (EMA) and a slow Weighted Moving Average (WMA) to identify potential bullish and bearish trend changes.
The indicator is designed to help traders identify high-probability intraday trading opportunities by filtering signals with both momentum and trend confirmation.
---
## How the Indicator Works
### 1. RSI (Relative Strength Index)
The indicator first calculates a 9-period RSI from the selected price source.
* RSI above 50 indicates bullish momentum.
* RSI below 50 indicates bearish momentum.
The 50 level acts as the primary trend filter.
---
### 2. EMA (3) of RSI
A 3-period Exponential Moving Average is applied to the RSI.
The EMA reacts quickly to changes in momentum and represents the short-term direction of the RSI.
---
### 3. WMA (21) of RSI
A 21-period Weighted Moving Average is also applied to the RSI.
The WMA moves more slowly than the EMA and represents the broader momentum trend.
---
### 4. RSI Background Color
The indicator colors the RSI area to provide quick visual confirmation of trend direction.
* **Red Background:** RSI is above 50 (Bullish Momentum)
* **Aqua Background:** RSI is below 50 (Bearish Momentum)
This allows traders to identify the prevailing momentum at a glance.
---
## Buy Signal
A BUY signal is generated only when all of the following conditions are satisfied:
* The 21-period WMA crosses above the RSI 50 level.
* The 3-period EMA is above the 21-period WMA.
* The RSI is above 50.
This combination indicates that both short-term and medium-term momentum have aligned in the bullish direction.
A BUY label is displayed on the chart when these conditions occur.
---
## Sell Signal
A SELL signal is generated only when all of the following conditions are satisfied:
* The 21-period WMA crosses below the RSI 50 level.
* The 3-period EMA is below the 21-period WMA.
* The RSI is below 50.
This indicates that bearish momentum has been confirmed.
A SELL label is displayed on the chart when these conditions occur.
---
## Alerts
The indicator provides TradingView alert conditions for both BUY and SELL signals.
These alerts can be used for:
* Pop-up notifications
* Mobile notifications
* Email alerts
* Webhook automation
---
## Recommended Timeframes
This indicator works on multiple timeframes, including:
* 3 Minute
* 5 Minute
* 15 Minute
* 30 Minute
* 1 Hour
It is particularly useful for intraday trading.
---
## Recommended Markets
The indicator can be used on:
* Stocks
* Index Futures
* Index Options
* ETFs
* Forex
* Commodities
* Cryptocurrencies
---
## Best Practice
For improved trade quality, use this indicator together with:
* Support and Resistance
* Volume Analysis
* VWAP
* Higher Timeframe Trend
* Risk Management
Avoid taking trades solely based on a single signal.
---
## Disclaimer
This indicator is designed by NK Sir as a technical analysis tool and should not be considered financial or investment advice. I Just Added BUY ,SELL Signals For Educational Purpose only .Please Add Hilega -Milega Indicator below your Chart to confirm Signals . Always perform your own analysis and use appropriate risk management before entering any trade.
## Overview
Hilega-Milega BUY SELL Signals is a momentum-based indicator built on the Relative Strength Index (RSI). It combines the RSI with a fast Exponential Moving Average (EMA) and a slow Weighted Moving Average (WMA) to identify potential bullish and bearish trend changes.
The indicator is designed to help traders identify high-probability intraday trading opportunities by filtering signals with both momentum and trend confirmation.
---
## How the Indicator Works
### 1. RSI (Relative Strength Index)
The indicator first calculates a 9-period RSI from the selected price source.
* RSI above 50 indicates bullish momentum.
* RSI below 50 indicates bearish momentum.
The 50 level acts as the primary trend filter.
---
### 2. EMA (3) of RSI
A 3-period Exponential Moving Average is applied to the RSI.
The EMA reacts quickly to changes in momentum and represents the short-term direction of the RSI.
---
### 3. WMA (21) of RSI
A 21-period Weighted Moving Average is also applied to the RSI.
The WMA moves more slowly than the EMA and represents the broader momentum trend.
---
### 4. RSI Background Color
The indicator colors the RSI area to provide quick visual confirmation of trend direction.
* **Red Background:** RSI is above 50 (Bullish Momentum)
* **Aqua Background:** RSI is below 50 (Bearish Momentum)
This allows traders to identify the prevailing momentum at a glance.
---
## Buy Signal
A BUY signal is generated only when all of the following conditions are satisfied:
* The 21-period WMA crosses above the RSI 50 level.
* The 3-period EMA is above the 21-period WMA.
* The RSI is above 50.
This combination indicates that both short-term and medium-term momentum have aligned in the bullish direction.
A BUY label is displayed on the chart when these conditions occur.
---
## Sell Signal
A SELL signal is generated only when all of the following conditions are satisfied:
* The 21-period WMA crosses below the RSI 50 level.
* The 3-period EMA is below the 21-period WMA.
* The RSI is below 50.
This indicates that bearish momentum has been confirmed.
A SELL label is displayed on the chart when these conditions occur.
---
## Alerts
The indicator provides TradingView alert conditions for both BUY and SELL signals.
These alerts can be used for:
* Pop-up notifications
* Mobile notifications
* Email alerts
* Webhook automation
---
## Recommended Timeframes
This indicator works on multiple timeframes, including:
* 3 Minute
* 5 Minute
* 15 Minute
* 30 Minute
* 1 Hour
It is particularly useful for intraday trading.
---
## Recommended Markets
The indicator can be used on:
* Stocks
* Index Futures
* Index Options
* ETFs
* Forex
* Commodities
* Cryptocurrencies
---
## Best Practice
For improved trade quality, use this indicator together with:
* Support and Resistance
* Volume Analysis
* VWAP
* Higher Timeframe Trend
* Risk Management
Avoid taking trades solely based on a single signal.
---
## Disclaimer
This indicator is designed by NK Sir as a technical analysis tool and should not be considered financial or investment advice. I Just Added BUY ,SELL Signals For Educational Purpose only .Please Add Hilega -Milega Indicator below your Chart to confirm Signals . Always perform your own analysis and use appropriate risk management before entering any trade.
Скрипт с открытым кодом
В истинном духе TradingView, создатель этого скрипта сделал его открытым исходным кодом, чтобы трейдеры могли проверить и убедиться в его функциональности. Браво автору! Вы можете использовать его бесплатно, но помните, что перепубликация кода подчиняется нашим Правилам поведения.

Отказ от ответственности
Информация и публикации не предназначены для предоставления и не являются финансовыми, инвестиционными, торговыми или другими видами советов или рекомендаций, предоставленных или одобренных TradingView. Подробнее читайте в Условиях использования.
Скрипт с открытым кодом
В истинном духе TradingView, создатель этого скрипта сделал его открытым исходным кодом, чтобы трейдеры могли проверить и убедиться в его функциональности. Браво автору! Вы можете использовать его бесплатно, но помните, что перепубликация кода подчиняется нашим Правилам поведения.
Отказ от ответственности
Информация и публикации не предназначены для предоставления и не являются финансовыми, инвестиционными, торговыми или другими видами советов или рекомендаций, предоставленных или одобренных TradingView. Подробнее читайте в Условиях использования.