OPEN-SOURCE SCRIPT
Обновлено NYSE Open 30s Range
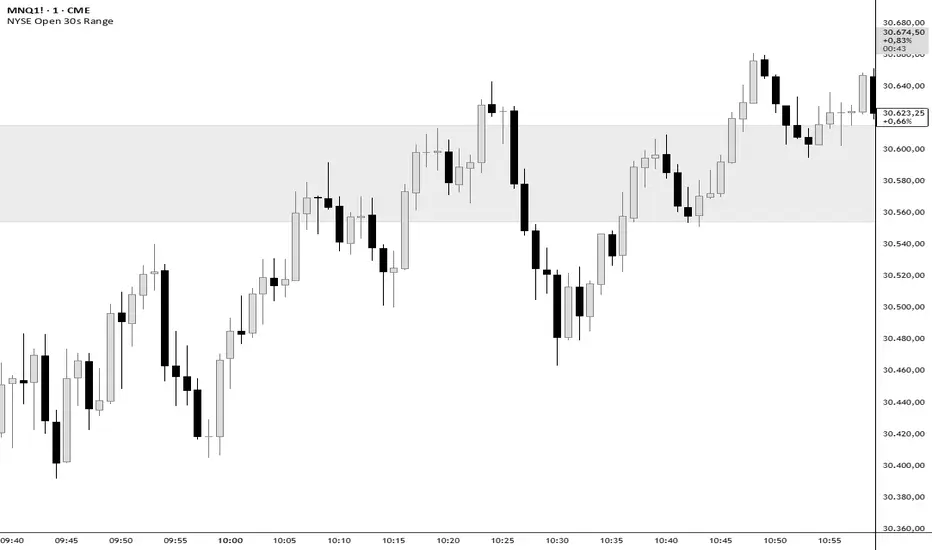
NYSE Opening Range (First 30s Candle)
This indicator automatically plots the NYSE Opening Range based exclusively on the first 30-second candle after the official market open (09:30:00 → 09:30:30 New York time).
The rectangle is drawn using the actual High and Low of that 30-second candle, remaining anchored to the correct opening timestamp regardless of the chart timeframe.
Features
✓ Automatically captures the first 30-second candle of the NYSE open
✓ Rectangle anchored to the actual opening time (does not shift when changing timeframes)
✓ Custom fill color
✓ Adjustable transparency
✓ Custom border color
✓ Multiple border styles (solid, dashed, dotted)
✓ Adjustable border thickness
✓ Adjustable horizontal extension of the range
How to Use
Wait for the first 30-second opening candle to form.
Use the range as a reference for:
Opening breakout setups
Opening rejection setups
Initial market liquidity
Intraday continuation or reversal scenarios
Notes:
The indicator uses internal 30-second data, allowing it to work even on higher chart timeframes.
Time is fixed to America/New_York to maintain alignment with the official NYSE opening session.
This indicator automatically plots the NYSE Opening Range based exclusively on the first 30-second candle after the official market open (09:30:00 → 09:30:30 New York time).
The rectangle is drawn using the actual High and Low of that 30-second candle, remaining anchored to the correct opening timestamp regardless of the chart timeframe.
Features
✓ Automatically captures the first 30-second candle of the NYSE open
✓ Rectangle anchored to the actual opening time (does not shift when changing timeframes)
✓ Custom fill color
✓ Adjustable transparency
✓ Custom border color
✓ Multiple border styles (solid, dashed, dotted)
✓ Adjustable border thickness
✓ Adjustable horizontal extension of the range
How to Use
Wait for the first 30-second opening candle to form.
Use the range as a reference for:
Opening breakout setups
Opening rejection setups
Initial market liquidity
Intraday continuation or reversal scenarios
Notes:
The indicator uses internal 30-second data, allowing it to work even on higher chart timeframes.
Time is fixed to America/New_York to maintain alignment with the official NYSE opening session.
Информация о релизе
Indicator updated to english.Скрипт с открытым кодом
В истинном духе TradingView, создатель этого скрипта сделал его открытым исходным кодом, чтобы трейдеры могли проверить и убедиться в его функциональности. Браво автору! Вы можете использовать его бесплатно, но помните, что перепубликация кода подчиняется нашим Правилам поведения.

Отказ от ответственности
Информация и публикации не предназначены для предоставления и не являются финансовыми, инвестиционными, торговыми или другими видами советов или рекомендаций, предоставленных или одобренных TradingView. Подробнее читайте в Условиях использования.
Скрипт с открытым кодом
В истинном духе TradingView, создатель этого скрипта сделал его открытым исходным кодом, чтобы трейдеры могли проверить и убедиться в его функциональности. Браво автору! Вы можете использовать его бесплатно, но помните, что перепубликация кода подчиняется нашим Правилам поведения.
Отказ от ответственности
Информация и публикации не предназначены для предоставления и не являются финансовыми, инвестиционными, торговыми или другими видами советов или рекомендаций, предоставленных или одобренных TradingView. Подробнее читайте в Условиях использования.