Multi Asset Momentum Screener [Pineify]
Overview
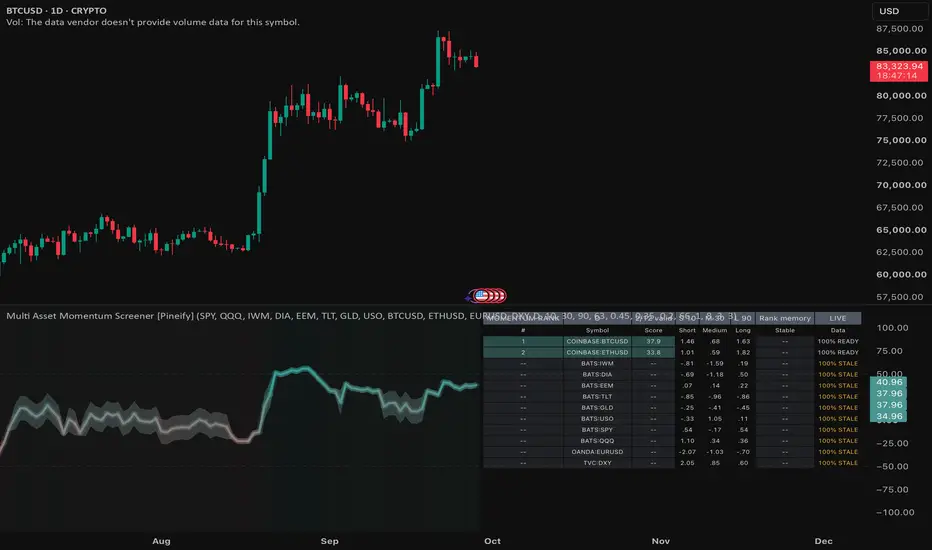
This screener compares twelve markets and ranks volatility-adjusted momentum only when coverage and timing pass. The heat table is primary; the chart-symbol score is the audit trail.
Problem Definition
A raw return leaderboard hides scale, horizon, and timing. The same move can be ordinary for a volatile asset and unusual for a quiet one. A recent jump may oppose slower momentum, while carried prices from different sessions can appear synchronized. One rank cannot show persistence. The model must normalize risk, expose conflict, reject incomplete or relatively stale rows, and remember rank movement without treating it as a forecast.
Design Rationale
Each horizon scales log return by one-bar realized volatility and square root of length, replacing raw sorting that favors volatile assets. Normalized weights combine readings; sign disagreement contracts the result, while a 35% floor preserves partial information. The -100 to +100 transform is not a probability. Timestamps and completeness replace blind forward filling. Stability updates only on a new requested-timeframe observation and confirmed chart bar. This delays abrupt rotations but avoids counting one unchanged value repeatedly.
Key Features
How It Works
One-bar log returns feed rolling standard deviation. Each N-bar log return is divided by that deviation times square root of N. Zero or unavailable volatility yields no value, and effective horizons are forced into increasing order.
Available readings enter a normalized weighted average. Agreement is the absolute sign sum divided by the count available. Multiplying by 0.35 plus 0.65 times agreement contracts conflict. For value x, 100 x / (2 + abs(x)) creates the bounded score; completeness is the share of horizons present.
Each request returns its source time. The newest enabled time is the reference; rows outside the lag allowance are STALE. Only enabled, fresh, complete scores receive deterministic ranks. At each new confirmed reference time, normalized rank displacement enters exponential 0-100 stability memory. The chart symbol uses the same model and ranks against valid rows even when absent from the list. Requests use confirmed bars; no future data.
How Multiple Indicators Work Together
The parts form one chain. Volatility makes returns comparable; three horizons reveal agreement; contraction stops averaging from hiding opposing signs; data gates decide admission; sorting supplies rank; and memory separates persistence from churn. Remove volatility and scale bias returns; remove gates and asynchronous samples mix; remove memory and only a transient leaderboard remains.
Trading Ideas and Insights
An aligned high positive score describes broad upward risk-adjusted momentum in this model; opposing components reduce coherence and widen the envelope. High stability can separate persistent strength from a brief jump, while falling stability can reveal rotation. Negative readings work symmetrically. Use these states for watchlist triage, not as an entry, exit, position size, holding period, or expected-return instruction.
Unique Aspects
The contribution is a synchronization-aware rank lattice. Admission depends on completeness and timing relative to the newest symbol, not on a carried value. Momentum strength is separated from rank-path stability, and memory advances only when the requested observation changes. The table exposes component risk units, making the score auditable. Originality lies in normalization, data-state handling, and rank memory rather than renaming momentum.
How to Use
Customization
Short horizons react faster but amplify gaps; long horizons need more history and lag more. Volatility Window changes the denominator's memory. Horizon weights change the analytical question, not just smoothness. Minimum Completeness decides whether two horizons suffice. Maximum Relative Data Lag controls mixed-session tolerance. Stability Memory trades faster rotation detection for steadier persistence. Visual switches do not alter calculations.
Assumptions and Limitations
Log returns and rolling deviation may not suit every asset. Scaling does not equalize liquidity, tail risk, leverage, contract rolls, currencies, sessions, or costs. Permissions, holidays, delays, or limited history can make rows WARM or STALE; relative time is not an exchange calendar.
Scores lag one comparison bar. Memory and alerts require confirmation and a new reference time. Inputs or history can recalculate results. Rank is basket-relative, and duplicates can distort it. There is no backtest, probability, accuracy, or profitability evidence.
Conclusion
Multi Asset Momentum Screener shows risk-adjusted momentum, data readiness, and persistence. Only complete, timely rows rank. It is research, not forecast or instruction.
This screener compares twelve markets and ranks volatility-adjusted momentum only when coverage and timing pass. The heat table is primary; the chart-symbol score is the audit trail.
Problem Definition
A raw return leaderboard hides scale, horizon, and timing. The same move can be ordinary for a volatile asset and unusual for a quiet one. A recent jump may oppose slower momentum, while carried prices from different sessions can appear synchronized. One rank cannot show persistence. The model must normalize risk, expose conflict, reject incomplete or relatively stale rows, and remember rank movement without treating it as a forecast.
Design Rationale
Each horizon scales log return by one-bar realized volatility and square root of length, replacing raw sorting that favors volatile assets. Normalized weights combine readings; sign disagreement contracts the result, while a 35% floor preserves partial information. The -100 to +100 transform is not a probability. Timestamps and completeness replace blind forward filling. Stability updates only on a new requested-timeframe observation and confirmed chart bar. This delays abrupt rotations but avoids counting one unchanged value repeatedly.
Key Features
- Twelve symbol slots with invalid-symbol tolerance.
- Three risk-scaled horizons with agreement and completeness gates.
- Relative freshness, sorted heat table, and rank-stability memory.
- Chart-symbol score plus top-rank and rank-change alerts.
How It Works
One-bar log returns feed rolling standard deviation. Each N-bar log return is divided by that deviation times square root of N. Zero or unavailable volatility yields no value, and effective horizons are forced into increasing order.
Available readings enter a normalized weighted average. Agreement is the absolute sign sum divided by the count available. Multiplying by 0.35 plus 0.65 times agreement contracts conflict. For value x, 100 x / (2 + abs(x)) creates the bounded score; completeness is the share of horizons present.
Each request returns its source time. The newest enabled time is the reference; rows outside the lag allowance are STALE. Only enabled, fresh, complete scores receive deterministic ranks. At each new confirmed reference time, normalized rank displacement enters exponential 0-100 stability memory. The chart symbol uses the same model and ranks against valid rows even when absent from the list. Requests use confirmed bars; no future data.
How Multiple Indicators Work Together
The parts form one chain. Volatility makes returns comparable; three horizons reveal agreement; contraction stops averaging from hiding opposing signs; data gates decide admission; sorting supplies rank; and memory separates persistence from churn. Remove volatility and scale bias returns; remove gates and asynchronous samples mix; remove memory and only a transient leaderboard remains.
Trading Ideas and Insights
An aligned high positive score describes broad upward risk-adjusted momentum in this model; opposing components reduce coherence and widen the envelope. High stability can separate persistent strength from a brief jump, while falling stability can reveal rotation. Negative readings work symmetrically. Use these states for watchlist triage, not as an entry, exit, position size, holding period, or expected-return instruction.
Unique Aspects
The contribution is a synchronization-aware rank lattice. Admission depends on completeness and timing relative to the newest symbol, not on a carried value. Momentum strength is separated from rank-path stability, and memory advances only when the requested observation changes. The table exposes component risk units, making the score auditable. Originality lies in normalization, data-state handling, and rank memory rather than renaming momentum.
How to Use
- Choose one timeframe suitable for every enabled market.
- Build a meaningful basket and inspect valid count plus Data status.
- Read Score with Short, Medium, Long, and Stable; withheld ranks are intentional.
- Use the chart spine for comparison; a wider envelope means more disagreement.
- Set alerts only after the basket and thresholds match your review.
Customization
Short horizons react faster but amplify gaps; long horizons need more history and lag more. Volatility Window changes the denominator's memory. Horizon weights change the analytical question, not just smoothness. Minimum Completeness decides whether two horizons suffice. Maximum Relative Data Lag controls mixed-session tolerance. Stability Memory trades faster rotation detection for steadier persistence. Visual switches do not alter calculations.
Assumptions and Limitations
Log returns and rolling deviation may not suit every asset. Scaling does not equalize liquidity, tail risk, leverage, contract rolls, currencies, sessions, or costs. Permissions, holidays, delays, or limited history can make rows WARM or STALE; relative time is not an exchange calendar.
Scores lag one comparison bar. Memory and alerts require confirmation and a new reference time. Inputs or history can recalculate results. Rank is basket-relative, and duplicates can distort it. There is no backtest, probability, accuracy, or profitability evidence.
Conclusion
Multi Asset Momentum Screener shows risk-adjusted momentum, data readiness, and persistence. Only complete, timely rows rank. It is research, not forecast or instruction.

🚀🚀🚀 Pineify - pineify.app
Essential Toolkit for Every Trader
- AI Pine Script Generator
- Finance AI Agent
- AI Stock Picker
- Pine Script Visual Editor
- Invited indicators
- Strategy Optimizer
- Trading Journal
- Backtest Report
Essential Toolkit for Every Trader
- AI Pine Script Generator
- Finance AI Agent
- AI Stock Picker
- Pine Script Visual Editor
- Invited indicators
- Strategy Optimizer
- Trading Journal
- Backtest Report
Отказ от ответственности
Информация и публикации не предназначены для предоставления и не являются финансовыми, инвестиционными, торговыми или другими видами советов или рекомендаций, предоставленных или одобренных TradingView. Подробнее читайте в Условиях использования.
🚀🚀🚀 Pineify - pineify.app
Essential Toolkit for Every Trader
- AI Pine Script Generator
- Finance AI Agent
- AI Stock Picker
- Pine Script Visual Editor
- Invited indicators
- Strategy Optimizer
- Trading Journal
- Backtest Report
Essential Toolkit for Every Trader
- AI Pine Script Generator
- Finance AI Agent
- AI Stock Picker
- Pine Script Visual Editor
- Invited indicators
- Strategy Optimizer
- Trading Journal
- Backtest Report
Отказ от ответственности
Информация и публикации не предназначены для предоставления и не являются финансовыми, инвестиционными, торговыми или другими видами советов или рекомендаций, предоставленных или одобренных TradingView. Подробнее читайте в Условиях использования.