OPEN-SOURCE SCRIPT
Обновлено 4H SMA20/SMA50 Cross Proximity
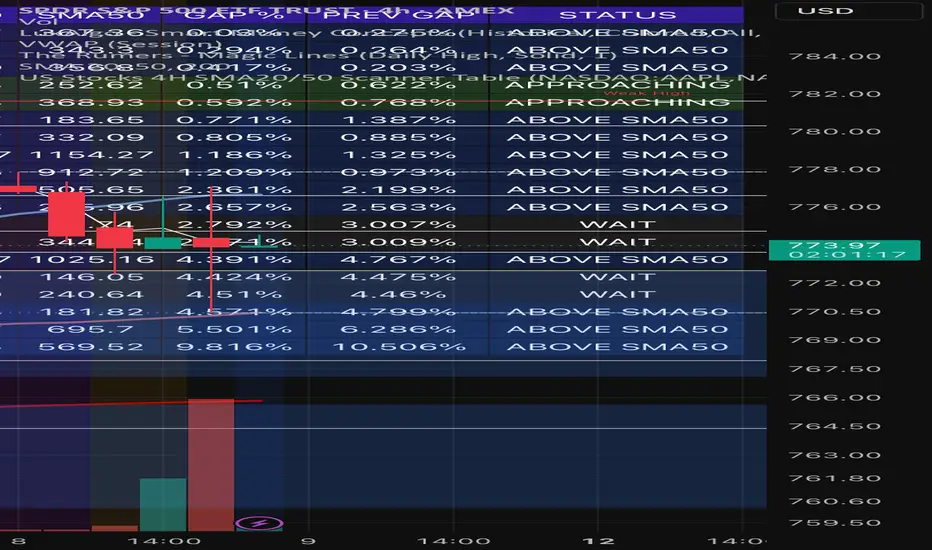
The script “4H Bullish SMA20/50 Proximity” is designed to find stocks where the 20-period Simple Moving Average (SMA20) is approaching the 50-period Simple Moving Average (SMA50) from below, potentially signaling an upcoming bullish crossover.
Here is what each part does.
1. Script settings
maxGap = input.float(1.0, "Maximum gap (%)", minval=0.01, step=0.05)
minGap = input.float(0.0, "Minimum gap (%)", minval=0.0, step=0.05)
These settings let you control how close the two moving averages must be.
- Maximum gap = 1.0%: The averages must be no more than 1% apart.
- Minimum gap = 0.0%: Allows all gaps from zero upward.
For example, if SMA50 is 100 and SMA20 is 99.80, the gap is 0.20%, so it meets the default distance thresholds.
2. Calculate the moving averages
sma20 = ta.sma(close, 20)
sma50 = ta.sma(close, 50)
- ta.sma(close, 20) calculates the average closing price of the last 20 candles.
- ta.sma(close, 50) calculates the average closing price of the last 50 candles.
Important: The script uses the timeframe selected in Pine Screener. To scan using 4-hour candles, set the screener interval to 4 hours.
3. Calculate the distance between the SMAs
gap = sma50 != 0 ? math.abs(sma20 - sma50) / math.abs(sma50) * 100 : na
This calculates the percentage distance between SMA20 and SMA50 relative to SMA50.
SMA20 SMA50 Gap
99.00 100.00 1.00%
99.50 100.00 0.50%
99.80 100.00 0.20%
99.95 100.00 0.05%
The smaller the gap, the closer the averages are to crossing.
4. Identify an approaching bullish crossover
approaching = sma20 < sma50 and gap >= minGap and gap <= maxGap and gap < gap[1]
This is the main condition. All four requirements must be true:
1. sma20 < sma50 — SMA20 is below SMA50, so the bullish crossover has not happened yet.
2. gap >= minGap — The distance meets your minimum threshold.
3. gap <= maxGap — The distance is within your maximum threshold.
4. gap < gap[1] — The distance is smaller than it was on the previous candle.
For example, if the gap decreases from 0.70% to 0.45% to 0.20%, the stock meets the narrowing-gap condition, provided the other requirements are satisfied.
If the gap starts increasing again, the approaching signal becomes false.
5. Make the results available to Pine Screener
plot(gap, "SMA Gap %", display=display.data_window)
plot(approaching ? 1 : 0, "Bullish Setup (1 = Yes)")
plot(sma20 < sma50 ? 1 : 0, "SMA20 Below SMA50")
These three plots expose values that you can use when filtering stocks.
Plot name Output Purpose
SMA Gap % Percentage Shows how close the SMAs are
Bullish Setup (1 = Yes) 1 or 0 Identifies stocks meeting all conditions
SMA20 Below SMA50 1 or 0 Confirms that SMA20 remains below SMA50
In Pine Screener, filter Bullish Setup (1 = Yes) to equal 1. That leaves stocks satisfying the approach conditions.
Note that SMA Gap % uses display.data_window, so it is available in the Data Window rather than being drawn as a visible chart line.
Recommended settings for your strategy
Maximum gap
0.50%
0.1%
1%
2%
Minimum gap
0.00%
0%
0.25%
0.5%
This configuration looks for a narrowing gap between 0.00% and 0.50% on the 4-hour timeframe.
Copy these settings
My starting recommendation is a maximum gap of 0.50% and a minimum of 0.00%. This is a tighter starting filter than 1%, but it may miss some early setups.
Limitation to remember: A narrowing gap does not guarantee a crossover. The averages may separate again, and this script does not estimate how many candles remain until the crossover.
Here is what each part does.
1. Script settings
maxGap = input.float(1.0, "Maximum gap (%)", minval=0.01, step=0.05)
minGap = input.float(0.0, "Minimum gap (%)", minval=0.0, step=0.05)
These settings let you control how close the two moving averages must be.
- Maximum gap = 1.0%: The averages must be no more than 1% apart.
- Minimum gap = 0.0%: Allows all gaps from zero upward.
For example, if SMA50 is 100 and SMA20 is 99.80, the gap is 0.20%, so it meets the default distance thresholds.
2. Calculate the moving averages
sma20 = ta.sma(close, 20)
sma50 = ta.sma(close, 50)
- ta.sma(close, 20) calculates the average closing price of the last 20 candles.
- ta.sma(close, 50) calculates the average closing price of the last 50 candles.
Important: The script uses the timeframe selected in Pine Screener. To scan using 4-hour candles, set the screener interval to 4 hours.
3. Calculate the distance between the SMAs
gap = sma50 != 0 ? math.abs(sma20 - sma50) / math.abs(sma50) * 100 : na
This calculates the percentage distance between SMA20 and SMA50 relative to SMA50.
SMA20 SMA50 Gap
99.00 100.00 1.00%
99.50 100.00 0.50%
99.80 100.00 0.20%
99.95 100.00 0.05%
The smaller the gap, the closer the averages are to crossing.
4. Identify an approaching bullish crossover
approaching = sma20 < sma50 and gap >= minGap and gap <= maxGap and gap < gap[1]
This is the main condition. All four requirements must be true:
1. sma20 < sma50 — SMA20 is below SMA50, so the bullish crossover has not happened yet.
2. gap >= minGap — The distance meets your minimum threshold.
3. gap <= maxGap — The distance is within your maximum threshold.
4. gap < gap[1] — The distance is smaller than it was on the previous candle.
For example, if the gap decreases from 0.70% to 0.45% to 0.20%, the stock meets the narrowing-gap condition, provided the other requirements are satisfied.
If the gap starts increasing again, the approaching signal becomes false.
5. Make the results available to Pine Screener
plot(gap, "SMA Gap %", display=display.data_window)
plot(approaching ? 1 : 0, "Bullish Setup (1 = Yes)")
plot(sma20 < sma50 ? 1 : 0, "SMA20 Below SMA50")
These three plots expose values that you can use when filtering stocks.
Plot name Output Purpose
SMA Gap % Percentage Shows how close the SMAs are
Bullish Setup (1 = Yes) 1 or 0 Identifies stocks meeting all conditions
SMA20 Below SMA50 1 or 0 Confirms that SMA20 remains below SMA50
In Pine Screener, filter Bullish Setup (1 = Yes) to equal 1. That leaves stocks satisfying the approach conditions.
Note that SMA Gap % uses display.data_window, so it is available in the Data Window rather than being drawn as a visible chart line.
Recommended settings for your strategy
Maximum gap
0.50%
0.1%
1%
2%
Minimum gap
0.00%
0%
0.25%
0.5%
This configuration looks for a narrowing gap between 0.00% and 0.50% on the 4-hour timeframe.
Copy these settings
My starting recommendation is a maximum gap of 0.50% and a minimum of 0.00%. This is a tighter starting filter than 1%, but it may miss some early setups.
Limitation to remember: A narrowing gap does not guarantee a crossover. The averages may separate again, and this script does not estimate how many candles remain until the crossover.
Информация о релизе
newСкрипт с открытым кодом
В истинном духе TradingView, создатель этого скрипта сделал его открытым исходным кодом, чтобы трейдеры могли проверить и убедиться в его функциональности. Браво автору! Вы можете использовать его бесплатно, но помните, что перепубликация кода подчиняется нашим Правилам поведения.

Отказ от ответственности
Информация и публикации не предназначены для предоставления и не являются финансовыми, инвестиционными, торговыми или другими видами советов или рекомендаций, предоставленных или одобренных TradingView. Подробнее читайте в Условиях использования.
Скрипт с открытым кодом
В истинном духе TradingView, создатель этого скрипта сделал его открытым исходным кодом, чтобы трейдеры могли проверить и убедиться в его функциональности. Браво автору! Вы можете использовать его бесплатно, но помните, что перепубликация кода подчиняется нашим Правилам поведения.
Отказ от ответственности
Информация и публикации не предназначены для предоставления и не являются финансовыми, инвестиционными, торговыми или другими видами советов или рекомендаций, предоставленных или одобренных TradingView. Подробнее читайте в Условиях использования.