Auction Volume Map [Golden_WolfAI]
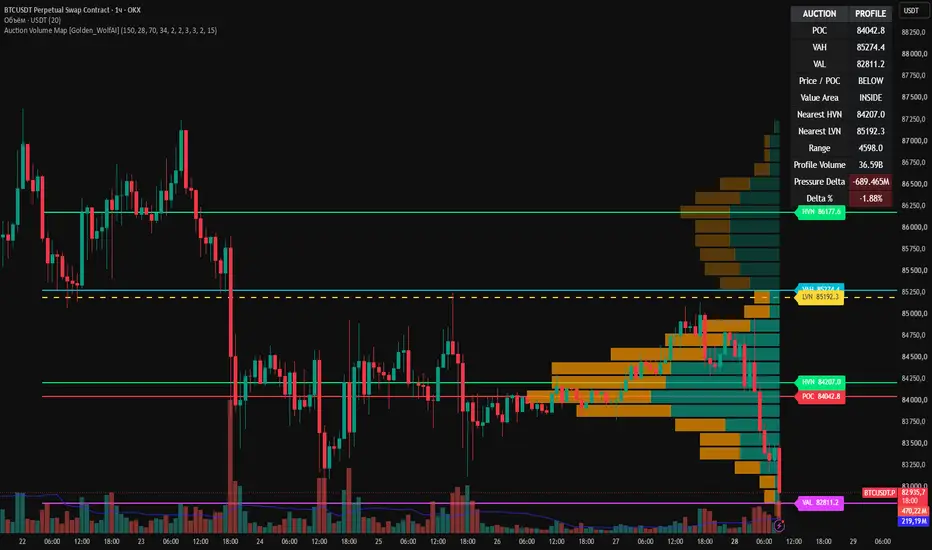
Auction Volume Map — POC + Value Area + HVN/LVN + Pressure Delta
Auction Volume Map is a price-volume structure indicator designed to visualize how volume is distributed across price levels over a configurable rolling range of recent bars.
The indicator builds a normalized volume-density profile and automatically calculates:
POC — Point of Control
VAH — Value Area High
VAL — Value Area Low
HVN — High Volume Nodes
LVN — Low Volume Nodes
Pressure Delta
Delta %
nearest HVN and LVN to the current price
current price position relative to POC and Value Area
The indicator also includes an information panel and built-in TradingView alert conditions.
Volume Distribution Model
The profile is calculated over the latest number of bars selected in the Lookback Bars setting.
The highest and lowest prices of the analyzed range define the vertical boundaries of the profile.
This range is then divided into a configurable number of price rows.
Unlike a basic candle-direction volume profile, Auction Volume Map does not simply assign the full volume of a bullish candle to buyers or the volume of a bearish candle to sellers.
Instead, each candle's volume is distributed across the price rows actually traded by that candle.
For every candle, the algorithm evaluates:
candle high;
candle low;
candle open;
candle close;
candle volume;
the amount of each profile row intersected by the candle.
The volume distribution is normalized so that the candle's total assigned volume remains consistent with its original reported volume.
Price-Density Weighting
Volume is not distributed uniformly across the entire candle range.
The algorithm gives additional weight to price rows located closer to the candle's HLC3 reference price:
HLC3 = (High + Low + Close) / 3
Rows farther away from this reference receive progressively lower weighting.
This creates a smoother density model that attempts to represent where volume was more likely concentrated within each candle's traded range.
The weighting is normalized separately for every candle before its volume is added to the profile.
For nearly flat candles, volume is assigned directly to the corresponding price row.
Pressure Model
Auction Volume Map separates the calculated density into:
Positive Pressure
and
Negative Pressure
This separation is estimated using two components.
Close Location
The first component measures where the candle closed inside its own high-low range.
A close near the high contributes more positive pressure.
A close near the low contributes more negative pressure.
Body Impulse
The second component measures the displacement from the candle open to the candle close relative to the candle's total range.
A strong bullish body increases positive pressure.
A strong bearish body increases negative pressure.
The final pressure estimate combines these two components:
close location receives the larger weighting;
body displacement provides the secondary contribution.
The resulting value is constrained to a normalized range and used to divide each candle's distributed volume between positive and negative pressure.
Pressure Delta
The indicator calculates total positive and negative pressure volume across the complete profile.
Pressure Delta = Positive Pressure Volume − Negative Pressure Volume
It also calculates:
Delta % = Pressure Delta / Total Profile Volume × 100
A positive value indicates that the calculated positive-pressure component is larger within the analyzed range.
A negative value indicates that the calculated negative-pressure component is larger.
Pressure Delta is displayed in the Profile Summary panel with contextual color highlighting.
Important
Pressure Delta is a model-based estimate.
It is not Bid/Ask Delta, does not use aggressor-side transaction data, and should not be interpreted as true order-flow delta.
POC — Point of Control
Point of Control represents the price row containing the highest calculated volume density in the current profile.
The POC level is displayed as a horizontal line and can optionally include a price label.
Because the indicator uses a rolling lookback window, the POC can move when new candles are added and older candles leave the analyzed range.
POC therefore represents the current volume-density center of the selected rolling window rather than a permanently fixed historical level.
Value Area
The Value Area represents the section of the profile containing the selected percentage of total profile volume.
The default value can be configured by the user.
The calculation begins at the POC.
From there, the Value Area expands in a balanced manner around the POC by progressively including price rows below and above the current area.
Expansion continues until the accumulated volume reaches the configured target percentage.
The final boundaries are:
VAH — Value Area High
and
VAL — Value Area Low
Both levels can be displayed directly on the chart with customizable colors, widths, and labels.
HVN — High Volume Nodes
High Volume Nodes identify significant local concentrations of volume within the profile.
Before HVN detection, the raw volume-density profile is smoothed using neighboring rows.
This reduces sensitivity to isolated single-row fluctuations.
The algorithm then searches for local peaks in the smoothed profile.
To qualify as an HVN candidate, a row must:
form a local volume peak;
be above the average row volume;
not be the POC itself.
Each candidate receives a strength score based on its local prominence relative to neighboring rows.
The strongest candidates are selected while respecting the configured minimum spacing between nodes.
This helps reduce clusters of nearly identical HVN levels.
LVN — Low Volume Nodes
Low Volume Nodes identify locally thin areas of the profile.
LVN detection uses the same smoothed volume-density structure as HVN detection.
A valid LVN candidate must:
form a local volume trough;
be below the average row volume.
Its strength is measured by how far the row lies below its neighboring profile values.
The strongest LVN candidates are selected while maintaining the configured minimum spacing.
LVN levels are displayed as dashed horizontal lines.
Why the Profile Is Smoothed
Raw volume distributions can contain small irregularities caused by individual candles, row boundaries, or limited sample size.
Auction Volume Map applies a lightweight three-row smoothing process before detecting HVN and LVN structures.
The center row receives the largest weighting, while neighboring rows contribute smaller weights.
This smoothing is used only for node detection.
The visible volume profile itself continues to represent the underlying calculated density.
Nearest HVN / LVN
The indicator automatically identifies the currently selected HVN and LVN levels closest to the market price.
These values are shown in the Profile Summary panel.
They are also used by the built-in HVN and LVN touch alert conditions.
Profile Visualization
The profile is drawn directly on the right side of the current price chart.
Each price row contains two components:
Positive Pressure Volume
and
Negative Pressure Volume
Rows located inside the Value Area use stronger colors, while rows outside the Value Area use more transparent profile colors.
The profile width automatically scales relative to the highest-volume row.
A dedicated profile-width setting allows the user to control how much horizontal chart space the profile occupies.
Profile Summary
The indicator includes a compact information panel displaying the main statistics of the current profile.
The panel includes:
POC
Current Point of Control price.
VAH
Current Value Area High.
VAL
Current Value Area Low.
Price / POC
Shows whether the current price is ABOVE, BELOW, or AT the POC.
Value Area
Shows whether the current price is ABOVE, INSIDE, or BELOW the Value Area.
Nearest HVN
Closest selected High Volume Node.
Nearest LVN
Closest selected Low Volume Node.
Range
Total price range covered by the current profile.
Profile Volume
Total volume represented by the profile.
Pressure Delta
Difference between calculated positive and negative pressure volume.
Delta %
Pressure Delta expressed as a percentage of total profile volume.
The text size of the panel can be adjusted in the indicator settings.
Alerts
Auction Volume Map includes built-in TradingView alert conditions.
Available alerts include:
POC Cross
Triggered when price crosses the current Point of Control.
VAH Cross
Triggered when price crosses the current Value Area High.
VAL Cross
Triggered when price crosses the current Value Area Low.
Value Area Exit
Triggered when price moves from inside the current Value Area to outside it.
Value Area Return
Triggered when price returns inside the current Value Area.
HVN Touch
Triggered when price touches the nearest currently detected High Volume Node.
LVN Touch
Triggered when price touches the nearest currently detected Low Volume Node.
These alerts can be selected through TradingView's standard alert creation interface after the indicator has been added to a chart.
Main Settings
Lookback Bars
Controls how many recent candles are included in the profile calculation.
A larger value produces a broader market structure view.
A smaller value makes the profile more responsive to recent price activity.
Profile Rows
Controls the vertical resolution of the profile.
More rows provide greater price detail.
Fewer rows create a smoother and more generalized structure.
Value Area %
Defines the percentage of total profile volume included in the Value Area.
Profile Width
Controls the horizontal width of the displayed profile.
POC Settings
Control POC visibility, color, width, and label display.
VAH / VAL Settings
Control Value Area boundary lines, labels, colors, and line width.
HVN / LVN Settings
Control:
node visibility;
number of HVNs;
number of LVNs;
minimum spacing between nodes;
node colors;
node labels.
Profile Summary
Controls the information panel and its text size.
Practical Interpretation
Auction Volume Map is intended to provide structural information rather than direct trade signals.
POC highlights the strongest calculated concentration of volume within the current rolling range.
Value Area shows the region containing the selected percentage of total calculated profile volume.
HVNs highlight local areas of comparatively high volume concentration.
LVNs highlight local areas where volume density is relatively thin.
Pressure Delta provides additional context about the directional characteristics of the candles contributing to the profile.
These elements can be used together to study how price is interacting with areas of high and low participation.
Rolling Profile Behavior
Auction Volume Map uses the most recent selected number of bars.
It is therefore a rolling profile, not a manually anchored fixed-range profile.
As a new bar appears:
the newest bar enters the calculation;
the oldest bar eventually leaves the calculation;
the profile distribution may change;
POC may move;
VAH and VAL may move;
HVN and LVN levels may change;
Pressure Delta may change.
This behavior is intentional.
The indicator continuously represents the current structure of the selected rolling market window.
Limitations
Auction Volume Map does not use tick-level Bid/Ask transaction data.
It does not identify aggressive buyers or sellers directly.
Positive and negative pressure are estimated from candle structure and close location.
The internal distribution of each candle's volume across price is modeled mathematically because standard chart volume does not provide the exact traded volume at every price inside an individual candle.
Results therefore depend on:
available volume data;
selected timeframe;
lookback length;
number of profile rows;
market structure.
The indicator should be treated as an analytical visualization tool rather than a direct representation of exchange-level order flow.
Intended Use
Auction Volume Map is designed for traders who want a compact visualization of:
volume distribution across price;
Point of Control;
Value Area;
High Volume Nodes;
Low Volume Nodes;
directional pressure balance;
current price location within the profile;
automated alerts around important profile levels.
The indicator combines these elements into one chart-based view while keeping the calculation methodology transparent and configurable.
Pine Script® Version 6
© 2026 Golden_WolfAI. All rights reserved.
This Pine Script® code is proprietary and confidential.
Unauthorized copying, modification, redistribution, publication, or commercial use is prohibited.
Auction Volume Map is a price-volume structure indicator designed to visualize how volume is distributed across price levels over a configurable rolling range of recent bars.
The indicator builds a normalized volume-density profile and automatically calculates:
POC — Point of Control
VAH — Value Area High
VAL — Value Area Low
HVN — High Volume Nodes
LVN — Low Volume Nodes
Pressure Delta
Delta %
nearest HVN and LVN to the current price
current price position relative to POC and Value Area
The indicator also includes an information panel and built-in TradingView alert conditions.
Volume Distribution Model
The profile is calculated over the latest number of bars selected in the Lookback Bars setting.
The highest and lowest prices of the analyzed range define the vertical boundaries of the profile.
This range is then divided into a configurable number of price rows.
Unlike a basic candle-direction volume profile, Auction Volume Map does not simply assign the full volume of a bullish candle to buyers or the volume of a bearish candle to sellers.
Instead, each candle's volume is distributed across the price rows actually traded by that candle.
For every candle, the algorithm evaluates:
candle high;
candle low;
candle open;
candle close;
candle volume;
the amount of each profile row intersected by the candle.
The volume distribution is normalized so that the candle's total assigned volume remains consistent with its original reported volume.
Price-Density Weighting
Volume is not distributed uniformly across the entire candle range.
The algorithm gives additional weight to price rows located closer to the candle's HLC3 reference price:
HLC3 = (High + Low + Close) / 3
Rows farther away from this reference receive progressively lower weighting.
This creates a smoother density model that attempts to represent where volume was more likely concentrated within each candle's traded range.
The weighting is normalized separately for every candle before its volume is added to the profile.
For nearly flat candles, volume is assigned directly to the corresponding price row.
Pressure Model
Auction Volume Map separates the calculated density into:
Positive Pressure
and
Negative Pressure
This separation is estimated using two components.
Close Location
The first component measures where the candle closed inside its own high-low range.
A close near the high contributes more positive pressure.
A close near the low contributes more negative pressure.
Body Impulse
The second component measures the displacement from the candle open to the candle close relative to the candle's total range.
A strong bullish body increases positive pressure.
A strong bearish body increases negative pressure.
The final pressure estimate combines these two components:
close location receives the larger weighting;
body displacement provides the secondary contribution.
The resulting value is constrained to a normalized range and used to divide each candle's distributed volume between positive and negative pressure.
Pressure Delta
The indicator calculates total positive and negative pressure volume across the complete profile.
Pressure Delta = Positive Pressure Volume − Negative Pressure Volume
It also calculates:
Delta % = Pressure Delta / Total Profile Volume × 100
A positive value indicates that the calculated positive-pressure component is larger within the analyzed range.
A negative value indicates that the calculated negative-pressure component is larger.
Pressure Delta is displayed in the Profile Summary panel with contextual color highlighting.
Important
Pressure Delta is a model-based estimate.
It is not Bid/Ask Delta, does not use aggressor-side transaction data, and should not be interpreted as true order-flow delta.
POC — Point of Control
Point of Control represents the price row containing the highest calculated volume density in the current profile.
The POC level is displayed as a horizontal line and can optionally include a price label.
Because the indicator uses a rolling lookback window, the POC can move when new candles are added and older candles leave the analyzed range.
POC therefore represents the current volume-density center of the selected rolling window rather than a permanently fixed historical level.
Value Area
The Value Area represents the section of the profile containing the selected percentage of total profile volume.
The default value can be configured by the user.
The calculation begins at the POC.
From there, the Value Area expands in a balanced manner around the POC by progressively including price rows below and above the current area.
Expansion continues until the accumulated volume reaches the configured target percentage.
The final boundaries are:
VAH — Value Area High
and
VAL — Value Area Low
Both levels can be displayed directly on the chart with customizable colors, widths, and labels.
HVN — High Volume Nodes
High Volume Nodes identify significant local concentrations of volume within the profile.
Before HVN detection, the raw volume-density profile is smoothed using neighboring rows.
This reduces sensitivity to isolated single-row fluctuations.
The algorithm then searches for local peaks in the smoothed profile.
To qualify as an HVN candidate, a row must:
form a local volume peak;
be above the average row volume;
not be the POC itself.
Each candidate receives a strength score based on its local prominence relative to neighboring rows.
The strongest candidates are selected while respecting the configured minimum spacing between nodes.
This helps reduce clusters of nearly identical HVN levels.
LVN — Low Volume Nodes
Low Volume Nodes identify locally thin areas of the profile.
LVN detection uses the same smoothed volume-density structure as HVN detection.
A valid LVN candidate must:
form a local volume trough;
be below the average row volume.
Its strength is measured by how far the row lies below its neighboring profile values.
The strongest LVN candidates are selected while maintaining the configured minimum spacing.
LVN levels are displayed as dashed horizontal lines.
Why the Profile Is Smoothed
Raw volume distributions can contain small irregularities caused by individual candles, row boundaries, or limited sample size.
Auction Volume Map applies a lightweight three-row smoothing process before detecting HVN and LVN structures.
The center row receives the largest weighting, while neighboring rows contribute smaller weights.
This smoothing is used only for node detection.
The visible volume profile itself continues to represent the underlying calculated density.
Nearest HVN / LVN
The indicator automatically identifies the currently selected HVN and LVN levels closest to the market price.
These values are shown in the Profile Summary panel.
They are also used by the built-in HVN and LVN touch alert conditions.
Profile Visualization
The profile is drawn directly on the right side of the current price chart.
Each price row contains two components:
Positive Pressure Volume
and
Negative Pressure Volume
Rows located inside the Value Area use stronger colors, while rows outside the Value Area use more transparent profile colors.
The profile width automatically scales relative to the highest-volume row.
A dedicated profile-width setting allows the user to control how much horizontal chart space the profile occupies.
Profile Summary
The indicator includes a compact information panel displaying the main statistics of the current profile.
The panel includes:
POC
Current Point of Control price.
VAH
Current Value Area High.
VAL
Current Value Area Low.
Price / POC
Shows whether the current price is ABOVE, BELOW, or AT the POC.
Value Area
Shows whether the current price is ABOVE, INSIDE, or BELOW the Value Area.
Nearest HVN
Closest selected High Volume Node.
Nearest LVN
Closest selected Low Volume Node.
Range
Total price range covered by the current profile.
Profile Volume
Total volume represented by the profile.
Pressure Delta
Difference between calculated positive and negative pressure volume.
Delta %
Pressure Delta expressed as a percentage of total profile volume.
The text size of the panel can be adjusted in the indicator settings.
Alerts
Auction Volume Map includes built-in TradingView alert conditions.
Available alerts include:
POC Cross
Triggered when price crosses the current Point of Control.
VAH Cross
Triggered when price crosses the current Value Area High.
VAL Cross
Triggered when price crosses the current Value Area Low.
Value Area Exit
Triggered when price moves from inside the current Value Area to outside it.
Value Area Return
Triggered when price returns inside the current Value Area.
HVN Touch
Triggered when price touches the nearest currently detected High Volume Node.
LVN Touch
Triggered when price touches the nearest currently detected Low Volume Node.
These alerts can be selected through TradingView's standard alert creation interface after the indicator has been added to a chart.
Main Settings
Lookback Bars
Controls how many recent candles are included in the profile calculation.
A larger value produces a broader market structure view.
A smaller value makes the profile more responsive to recent price activity.
Profile Rows
Controls the vertical resolution of the profile.
More rows provide greater price detail.
Fewer rows create a smoother and more generalized structure.
Value Area %
Defines the percentage of total profile volume included in the Value Area.
Profile Width
Controls the horizontal width of the displayed profile.
POC Settings
Control POC visibility, color, width, and label display.
VAH / VAL Settings
Control Value Area boundary lines, labels, colors, and line width.
HVN / LVN Settings
Control:
node visibility;
number of HVNs;
number of LVNs;
minimum spacing between nodes;
node colors;
node labels.
Profile Summary
Controls the information panel and its text size.
Practical Interpretation
Auction Volume Map is intended to provide structural information rather than direct trade signals.
POC highlights the strongest calculated concentration of volume within the current rolling range.
Value Area shows the region containing the selected percentage of total calculated profile volume.
HVNs highlight local areas of comparatively high volume concentration.
LVNs highlight local areas where volume density is relatively thin.
Pressure Delta provides additional context about the directional characteristics of the candles contributing to the profile.
These elements can be used together to study how price is interacting with areas of high and low participation.
Rolling Profile Behavior
Auction Volume Map uses the most recent selected number of bars.
It is therefore a rolling profile, not a manually anchored fixed-range profile.
As a new bar appears:
the newest bar enters the calculation;
the oldest bar eventually leaves the calculation;
the profile distribution may change;
POC may move;
VAH and VAL may move;
HVN and LVN levels may change;
Pressure Delta may change.
This behavior is intentional.
The indicator continuously represents the current structure of the selected rolling market window.
Limitations
Auction Volume Map does not use tick-level Bid/Ask transaction data.
It does not identify aggressive buyers or sellers directly.
Positive and negative pressure are estimated from candle structure and close location.
The internal distribution of each candle's volume across price is modeled mathematically because standard chart volume does not provide the exact traded volume at every price inside an individual candle.
Results therefore depend on:
available volume data;
selected timeframe;
lookback length;
number of profile rows;
market structure.
The indicator should be treated as an analytical visualization tool rather than a direct representation of exchange-level order flow.
Intended Use
Auction Volume Map is designed for traders who want a compact visualization of:
volume distribution across price;
Point of Control;
Value Area;
High Volume Nodes;
Low Volume Nodes;
directional pressure balance;
current price location within the profile;
automated alerts around important profile levels.
The indicator combines these elements into one chart-based view while keeping the calculation methodology transparent and configurable.
Pine Script® Version 6
© 2026 Golden_WolfAI. All rights reserved.
This Pine Script® code is proprietary and confidential.
Unauthorized copying, modification, redistribution, publication, or commercial use is prohibited.

Отказ от ответственности
Информация и публикации не предназначены для предоставления и не являются финансовыми, инвестиционными, торговыми или другими видами советов или рекомендаций, предоставленных или одобренных TradingView. Подробнее читайте в Условиях использования.
Отказ от ответственности
Информация и публикации не предназначены для предоставления и не являются финансовыми, инвестиционными, торговыми или другими видами советов или рекомендаций, предоставленных или одобренных TradingView. Подробнее читайте в Условиях использования.