Обновлено
Average Daily Volume with Anomalies
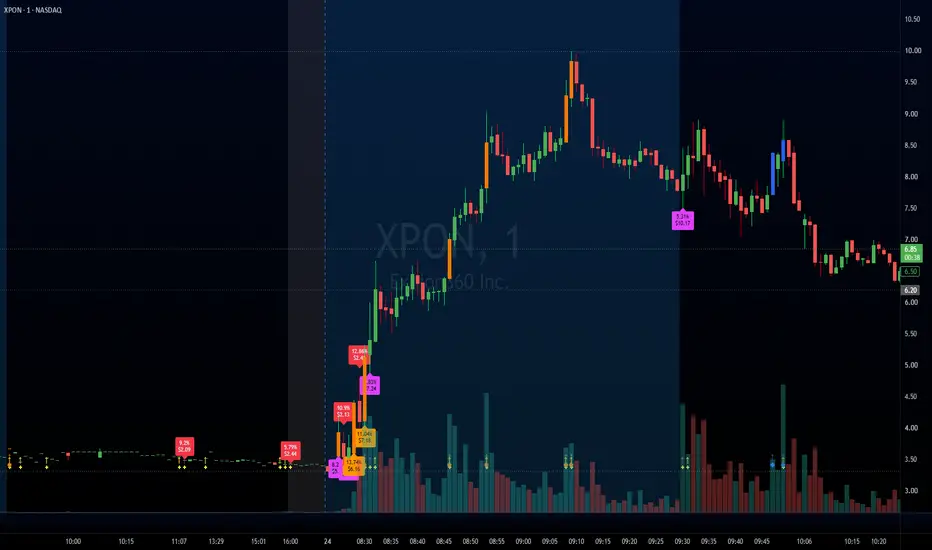
A trigger program to print volume triggers on stocks that are being watched.
It helps with identifying the trigger volume on a candle and helps determine whether one can enter a position or not.
It helps with identifying the trigger volume on a candle and helps determine whether one can enter a position or not.
Информация о релизе
Added Volume Trigger indicator, users can now configure the volume trigger at which they think the buy came into effect and create an alert for the sameИнформация о релизе
Added blue square marker to show if the price and volume is higher than last two bars, it is like a pre cursor to an upcoming volume, however it will be confirmed by the volume anomaly in the subsequent bars.Информация о релизе
added relative volume threshold to indicate incoming bullish surge. User can choose to display the relative volume threshold label from the settings. If both Vol anomaly and rvol threshold prints then there is a high probability that price can move up from the first time rvol + anomaly was printed. Also added a alert when the threshold reaaches.Информация о релизе
Updated to add possible price move information, the factor can be changed from settings.Информация о релизе
Formatted RVOL % and Possible Price Movement to 2 decimalИнформация о релизе
Format changeИнформация о релизе
Corrected possible price movement formulaИнформация о релизе
Added configurable take profit lines for easy scalping, the take profit percentage is configurable based on the most recent RVOL label printed.Информация о релизе
Added configurable TP Cap, the expected price movement will not exceed the configured %Информация о релизе
Added Bearish RVOL label for reference, if bearish label appears without any bullish RVOL label then it is a rapidly moving down.Информация о релизе
Added previous TP lines to be visible to get price context.performance optimization and streamline
Информация о релизе
introduced a configurable high extreme threshold and color setting within the RVOL parameters, allowing for more granular visualization of volume spikes. The script now dynamically updates the label background to the high extreme color whenever relative volume exceeds the new threshold, defaulting to yellow at a value of 11.Информация о релизе
Added bullish breakouts by highlighting candles where both the closing price and trading volume simultaneously exceed their highest levels from a user-defined lookback period. It provides customizable visual feedback through bar coloring and includes built-in alerts to help traders spot these high-conviction momentum signals in real-time.Информация о релизе
Added a average volume condition for painting the bars blue which is by default disabled in the panel. Enabling this ensures the bars are painted blue if the volume was double than the last average of 'X' lookback candles Информация о релизе
Added the High of Day (HoD) logic which acts like a tracker that starts fresh every time the market opens, recording the highest point the price reaches during that session. If the current candle finishes forming (closes) above that tracked high point, it means a new peak has been reached. When this happens, the script highlights that specific candle in yellow to alert you of the new high.Информация о релизе
Updated the TP lines to use the same color as the RVOL label color to keep them visually consistent Информация о релизе
Added option to choose for TP calculations, users can choose between linear and fib settingsИнформация о релизе
Minor visual updates for TP lines and labels in configuration panelИнформация о релизе
Added the HoD volume qualification:New “HoD Volume Lookback” input under High of Day Settings
Default value: 9 bars
HoD coloring now occurs only when the current volume is greater than the highest volume of the previous 9 bars
Информация о релизе
The HoD volume lookback now adapts automatically:Base lookback: 9 bars
High-volume regime: 12 bars
Low-volume regime: 6 bars
The current volume regime is determined by comparing current volume with the average of the preceding 20 bars.
HoD coloring occurs only when current volume exceeds the highest volume in the dynamically selected lookback period.

Отказ от ответственности
Информация и публикации не предназначены для предоставления и не являются финансовыми, инвестиционными, торговыми или другими видами советов или рекомендаций, предоставленных или одобренных TradingView. Подробнее читайте в Условиях использования.
Отказ от ответственности
Информация и публикации не предназначены для предоставления и не являются финансовыми, инвестиционными, торговыми или другими видами советов или рекомендаций, предоставленных или одобренных TradingView. Подробнее читайте в Условиях использования.