OPEN-SOURCE SCRIPT
OrderFlow FVG Matrix MTF | ProjectSyndicate
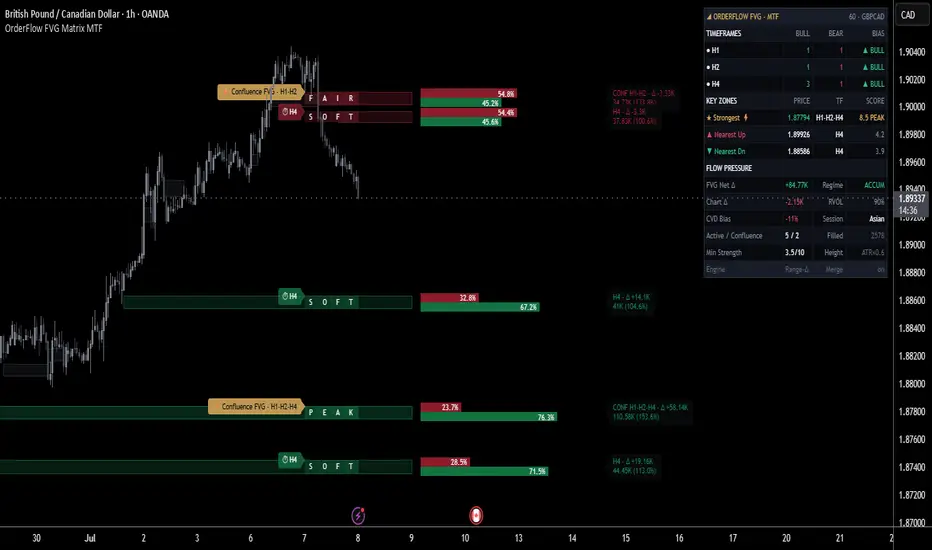
OrderFlow FVG Matrix reads every Fair Value Gap through the lens of the order flow that created it, across three timeframes at once, then commits a single shaded imbalance zone only where the gap, the delta behind it, and the timeframes agree. Instead of drawing every three-candle gap as an identical box, it detects gaps on your chosen higher timeframes, decomposes the volume that formed each one into buying versus selling, scores the imbalance 0–10 on six order-flow-native factors, and fuses overlapping gaps into one Confluence zone tagged with every timeframe that produced it. Each zone carries its own maroon/green buy-versus-sell split, net delta, absorption and relative-volume read, is normalized to a universal height so none dominate the chart, re-scores as price develops, and is neutralized the moment price mitigates it — while a live diagnostics panel shows the full multi-timeframe order-flow picture driving every zone on the symbol and timeframe you trade.
🧠 Order-Flow Core — the central idea. Every gap is graded not by its size but by the flow that built it. Each of the three candles that form an FVG has its volume split into buying versus selling from where price closed within that candle's range, then summed across the formation to yield buy volume, sell volume, net delta, and a wick-rejection absorption estimate; relative volume compares that participation to a rolling baseline. This is what separates a gap born of violent one-sided displacement from a thin, low-conviction gap that merely looks the same. Because the read is derived from price geometry rather than lower-timeframe intrabar requests, it keeps working even where only tick volume is available — gold, FX, and similar instruments — instead of going blank.
📐 Multi-Timeframe FVG Detection — three lenses, one map. Gaps are detected independently on three fully configurable timeframes (default H1 · H2 · H4), with bullish and bearish detection separately toggleable. Each timeframe runs its own self-contained detector on its own confirmed bars, and a gap must clear an ATR (or percent-of-price) filter to qualify. Higher-timeframe data is read with no lookahead, so a zone's price, class and statistics are fixed once its bar closes — the zones do not repaint.
🔗 Confluence Merging — no overlapping zones, ever. When two same-direction zones overlap within an adjustable ATR tolerance, they fuse into one. The order flow is re-aggregated — volumes and delta summed, buy/sell percentage and relative volume recomputed, the band re-centered on the weighted midpoint — and the zone is re-labeled Confluence FVG · H1·H2·H4 with every contributing timeframe, its strength lifted by a confluence bonus for each extra timeframe stacked in. The consolidation repeats until nothing overlaps, so the chart never stacks bands or duplicates labels: three timeframes agreeing at a level read as one stronger zone, not a cluttered pile.
📏 Universal Zone Height. Every gap is normalized to a single fixed height — ATR-based or a percentage of price — centered on the gap's midpoint. Thin gaps and wide gaps render as uniform bands, so no imbalance becomes a tall tower and the chart stays clean; the strength score, not the raw gap size, tells you which levels actually matter.
⭐ 6-Factor Strength Engine (0–10). Each zone is scored on six order-flow-native factors, every weight adjustable: Displacement (gap size versus ATR), Delta Alignment (did buying confirm a bullish gap, or selling a bearish one), Relative Volume (participation versus baseline), Flow Dominance (how one-sided the split was), Middle-Candle Body (displacement conviction), and Absorption (wick-rejection volume). The result maps to a tier word rendered inside the zone — WEAK · SOFT · FAIR · HIGH · PEAK — and to a star read on the dashboard. Read it as a confluence / cleanliness rank: how textbook the imbalance is, not a guaranteed outcome.
🎯 Shaded Zones + Order-Flow Split Bars. Each zone is a maroon (bearish) or dark-green (bullish) shaded band, opacity graded by strength, with the tier word spelled across gradient cells and a timeframe / confluence badge pinned to it. To the right of price, a two-bar order-flow split renders the bearish percentage (maroon) over the bullish percentage (dark green), and a stat label prints net delta, total volume and relative volume — so the participation behind every level is visible at a glance and factored into how it is graded.
🩶 Self-Invalidation + Filled History. Zones extend forward and re-score as price develops. The instant price mitigates a zone — by Touch, 50% fill, or full fill, your choice — it is neutralized: recolored to a muted dark-grey and frozen, so a filled level reads as spent context, never as a live signal. A history cap keeps grey levels from accumulating into clutter, and you can drop filled zones entirely for a strictly-live view.
📊 Live Multi-Timeframe Dashboard. A compact institutional panel tracks, in real time on your chart: a per-timeframe grid — active bull and bear zone counts plus directional bias for each of your three timeframes; Key Zones — the strongest zone, plus the nearest zone above and below price, each with its timeframe set and star score; Flow Pressure — aggregate FVG net delta with an ACCUM / DISTRIB regime read, live chart delta, relative volume, CVD bias and session; and running active / confluence / filled counts. It is a live read of the engine's current state on your symbol — not a backtest and not a printed statistic.
🎚️ Declutter & Conviction Controls. A tight set of dials governs how busy and how selective the chart is: Min Strength filters out weak imbalances; Merge Distance (×ATR) sets how aggressively overlapping zones fuse; Max Zones caps the live set; the mitigation rule and filled-history toggle decide how decisively price must close through a level and whether history stays; and the universal-height and flow-bar dimensions tune density. Tighten for a clean, high-conviction map; loosen for full structural context.
🎨 Clean Themed Visuals. A dark institutional palette built around maroon and dark green — the classic imbalance / order-flow color language — colors the zone bands, tier cells, flow bars, badges, labels and dashboard into one coherent look, so class and conviction read at a glance. Every zone, bar and mitigated color is exposed as an input, so you can match the scheme to your chart.
🔔 Alerts. Fires on a new bullish MTF FVG, a new bearish MTF FVG, and any new MTF FVG — formatted for manual or automated use — so you can be pinged when a fresh imbalance forms rather than watching the chart.
🔧 Fully Customizable. Every component is exposed: the three timeframes and direction toggles; the ATR / percent gap filter and ATR length; universal-height mode and size; all six strength weights, the min-strength gate and the relative-volume baseline; merge distance and confluence bonus; the mitigation rule and filled-history tone; every zone, bar and mitigated color; badge, tier-word, flow-bar and stat-label visibility and dimensions; extend length and max zones; and dashboard position and size.
🎯 Why this is different. Most FVG tools draw every three-candle gap as an identical box and leave interpretation to you — a gap that formed on violent one-sided displacement looks exactly like a thin, low-conviction one, and three timeframes worth of gaps stack into an unreadable ladder. This engine reads the order flow behind each gap, scores it 0–10 on six flow-native factors, fuses agreeing timeframes into a single labeled Confluence zone, normalizes every level to one height, re-scores it on development, and neutralizes it the instant it fills — then surfaces the whole multi-timeframe rationale on a live panel. You are looking at classified, ranked, self-invalidating imbalances with the order-flow reasoning attached, not an undifferentiated field of boxes.
🚀 Where to use it. Symbol- and timeframe-agnostic — it runs on forex, indices, metals, crypto and equities across intraday and higher timeframes. Because the score and split use volume, it is sharpest on instruments where volume is meaningful; the range-position delta model is specifically built to keep working on tick-volume instruments like gold and FX, where lower-timeframe intrabar data is unavailable, and it degrades gracefully rather than failing. Keep the chart timeframe at or below your lowest selected zone timeframe for full detail; larger timeframes yield fewer, more significant zones, smaller ones a more reactive map.
🎯 How to trade it. Apply it to a liquid instrument and let the zones and dashboard populate. Read the per-timeframe bias and Flow Pressure for the prevailing order-flow lean, and favor high-strength and Confluence zones — where multiple timeframes and the delta agree — over isolated single-timeframe gaps. Treat each zone as a decision level: plan entries on a controlled retest into the band, define invalidation by the same decisive close-through that neutralizes the zone on the chart, and manage targets against the next opposing zone or your own R model. Use Min Strength, Merge Distance and Max Zones to set chart density — stricter for a clean, high-conviction map, looser for full structure — and use the star score to focus on the cleanest imbalances.
⚠️ Important — this is a decision-support tool, not a standalone buy/sell system, and it makes no performance guarantees. The order-flow read is a volume-delta estimate derived from price geometry — and, on many instruments, from tick volume — not true exchange order flow or bid/ask tape; treat it as a well-behaved approximation, not the book. The 0–10 score is a confluence / cleanliness rank that describes how textbook an imbalance is; it is not a probability or a promise of outcome, and the dashboard is a live read of the engine's current state, not a backtest or forecast. Zones confirm on closed higher-timeframe bars, so they print with the built-in confirmation lag and you should always wait for a settled level. Always pair it with higher-timeframe context, your own analysis, and disciplined risk management, and test it on your market and timeframe before trading it live.
🧠 Order-Flow Core — the central idea. Every gap is graded not by its size but by the flow that built it. Each of the three candles that form an FVG has its volume split into buying versus selling from where price closed within that candle's range, then summed across the formation to yield buy volume, sell volume, net delta, and a wick-rejection absorption estimate; relative volume compares that participation to a rolling baseline. This is what separates a gap born of violent one-sided displacement from a thin, low-conviction gap that merely looks the same. Because the read is derived from price geometry rather than lower-timeframe intrabar requests, it keeps working even where only tick volume is available — gold, FX, and similar instruments — instead of going blank.
📐 Multi-Timeframe FVG Detection — three lenses, one map. Gaps are detected independently on three fully configurable timeframes (default H1 · H2 · H4), with bullish and bearish detection separately toggleable. Each timeframe runs its own self-contained detector on its own confirmed bars, and a gap must clear an ATR (or percent-of-price) filter to qualify. Higher-timeframe data is read with no lookahead, so a zone's price, class and statistics are fixed once its bar closes — the zones do not repaint.
🔗 Confluence Merging — no overlapping zones, ever. When two same-direction zones overlap within an adjustable ATR tolerance, they fuse into one. The order flow is re-aggregated — volumes and delta summed, buy/sell percentage and relative volume recomputed, the band re-centered on the weighted midpoint — and the zone is re-labeled Confluence FVG · H1·H2·H4 with every contributing timeframe, its strength lifted by a confluence bonus for each extra timeframe stacked in. The consolidation repeats until nothing overlaps, so the chart never stacks bands or duplicates labels: three timeframes agreeing at a level read as one stronger zone, not a cluttered pile.
📏 Universal Zone Height. Every gap is normalized to a single fixed height — ATR-based or a percentage of price — centered on the gap's midpoint. Thin gaps and wide gaps render as uniform bands, so no imbalance becomes a tall tower and the chart stays clean; the strength score, not the raw gap size, tells you which levels actually matter.
⭐ 6-Factor Strength Engine (0–10). Each zone is scored on six order-flow-native factors, every weight adjustable: Displacement (gap size versus ATR), Delta Alignment (did buying confirm a bullish gap, or selling a bearish one), Relative Volume (participation versus baseline), Flow Dominance (how one-sided the split was), Middle-Candle Body (displacement conviction), and Absorption (wick-rejection volume). The result maps to a tier word rendered inside the zone — WEAK · SOFT · FAIR · HIGH · PEAK — and to a star read on the dashboard. Read it as a confluence / cleanliness rank: how textbook the imbalance is, not a guaranteed outcome.
🎯 Shaded Zones + Order-Flow Split Bars. Each zone is a maroon (bearish) or dark-green (bullish) shaded band, opacity graded by strength, with the tier word spelled across gradient cells and a timeframe / confluence badge pinned to it. To the right of price, a two-bar order-flow split renders the bearish percentage (maroon) over the bullish percentage (dark green), and a stat label prints net delta, total volume and relative volume — so the participation behind every level is visible at a glance and factored into how it is graded.
🩶 Self-Invalidation + Filled History. Zones extend forward and re-score as price develops. The instant price mitigates a zone — by Touch, 50% fill, or full fill, your choice — it is neutralized: recolored to a muted dark-grey and frozen, so a filled level reads as spent context, never as a live signal. A history cap keeps grey levels from accumulating into clutter, and you can drop filled zones entirely for a strictly-live view.
📊 Live Multi-Timeframe Dashboard. A compact institutional panel tracks, in real time on your chart: a per-timeframe grid — active bull and bear zone counts plus directional bias for each of your three timeframes; Key Zones — the strongest zone, plus the nearest zone above and below price, each with its timeframe set and star score; Flow Pressure — aggregate FVG net delta with an ACCUM / DISTRIB regime read, live chart delta, relative volume, CVD bias and session; and running active / confluence / filled counts. It is a live read of the engine's current state on your symbol — not a backtest and not a printed statistic.
🎚️ Declutter & Conviction Controls. A tight set of dials governs how busy and how selective the chart is: Min Strength filters out weak imbalances; Merge Distance (×ATR) sets how aggressively overlapping zones fuse; Max Zones caps the live set; the mitigation rule and filled-history toggle decide how decisively price must close through a level and whether history stays; and the universal-height and flow-bar dimensions tune density. Tighten for a clean, high-conviction map; loosen for full structural context.
🎨 Clean Themed Visuals. A dark institutional palette built around maroon and dark green — the classic imbalance / order-flow color language — colors the zone bands, tier cells, flow bars, badges, labels and dashboard into one coherent look, so class and conviction read at a glance. Every zone, bar and mitigated color is exposed as an input, so you can match the scheme to your chart.
🔔 Alerts. Fires on a new bullish MTF FVG, a new bearish MTF FVG, and any new MTF FVG — formatted for manual or automated use — so you can be pinged when a fresh imbalance forms rather than watching the chart.
🔧 Fully Customizable. Every component is exposed: the three timeframes and direction toggles; the ATR / percent gap filter and ATR length; universal-height mode and size; all six strength weights, the min-strength gate and the relative-volume baseline; merge distance and confluence bonus; the mitigation rule and filled-history tone; every zone, bar and mitigated color; badge, tier-word, flow-bar and stat-label visibility and dimensions; extend length and max zones; and dashboard position and size.
🎯 Why this is different. Most FVG tools draw every three-candle gap as an identical box and leave interpretation to you — a gap that formed on violent one-sided displacement looks exactly like a thin, low-conviction one, and three timeframes worth of gaps stack into an unreadable ladder. This engine reads the order flow behind each gap, scores it 0–10 on six flow-native factors, fuses agreeing timeframes into a single labeled Confluence zone, normalizes every level to one height, re-scores it on development, and neutralizes it the instant it fills — then surfaces the whole multi-timeframe rationale on a live panel. You are looking at classified, ranked, self-invalidating imbalances with the order-flow reasoning attached, not an undifferentiated field of boxes.
🚀 Where to use it. Symbol- and timeframe-agnostic — it runs on forex, indices, metals, crypto and equities across intraday and higher timeframes. Because the score and split use volume, it is sharpest on instruments where volume is meaningful; the range-position delta model is specifically built to keep working on tick-volume instruments like gold and FX, where lower-timeframe intrabar data is unavailable, and it degrades gracefully rather than failing. Keep the chart timeframe at or below your lowest selected zone timeframe for full detail; larger timeframes yield fewer, more significant zones, smaller ones a more reactive map.
🎯 How to trade it. Apply it to a liquid instrument and let the zones and dashboard populate. Read the per-timeframe bias and Flow Pressure for the prevailing order-flow lean, and favor high-strength and Confluence zones — where multiple timeframes and the delta agree — over isolated single-timeframe gaps. Treat each zone as a decision level: plan entries on a controlled retest into the band, define invalidation by the same decisive close-through that neutralizes the zone on the chart, and manage targets against the next opposing zone or your own R model. Use Min Strength, Merge Distance and Max Zones to set chart density — stricter for a clean, high-conviction map, looser for full structure — and use the star score to focus on the cleanest imbalances.
⚠️ Important — this is a decision-support tool, not a standalone buy/sell system, and it makes no performance guarantees. The order-flow read is a volume-delta estimate derived from price geometry — and, on many instruments, from tick volume — not true exchange order flow or bid/ask tape; treat it as a well-behaved approximation, not the book. The 0–10 score is a confluence / cleanliness rank that describes how textbook an imbalance is; it is not a probability or a promise of outcome, and the dashboard is a live read of the engine's current state, not a backtest or forecast. Zones confirm on closed higher-timeframe bars, so they print with the built-in confirmation lag and you should always wait for a settled level. Always pair it with higher-timeframe context, your own analysis, and disciplined risk management, and test it on your market and timeframe before trading it live.
Скрипт с открытым кодом
В истинном духе TradingView, создатель этого скрипта сделал его открытым исходным кодом, чтобы трейдеры могли проверить и убедиться в его функциональности. Браво автору! Вы можете использовать его бесплатно, но помните, что перепубликация кода подчиняется нашим Правилам поведения.

Institutional-desk · 10+ yrs building trading algos
Syndicate Ultimate · 4 systems · 1 bundle
· 1 payment · lifetime access
Gold · FX · NQ/ES · private systems
syndicate001.com
TG channel
t.me/aisyndicate001
Syndicate Ultimate · 4 systems · 1 bundle
· 1 payment · lifetime access
Gold · FX · NQ/ES · private systems
syndicate001.com
TG channel
t.me/aisyndicate001
Отказ от ответственности
Информация и публикации не предназначены для предоставления и не являются финансовыми, инвестиционными, торговыми или другими видами советов или рекомендаций, предоставленных или одобренных TradingView. Подробнее читайте в Условиях использования.
Скрипт с открытым кодом
В истинном духе TradingView, создатель этого скрипта сделал его открытым исходным кодом, чтобы трейдеры могли проверить и убедиться в его функциональности. Браво автору! Вы можете использовать его бесплатно, но помните, что перепубликация кода подчиняется нашим Правилам поведения.
Institutional-desk · 10+ yrs building trading algos
Syndicate Ultimate · 4 systems · 1 bundle
· 1 payment · lifetime access
Gold · FX · NQ/ES · private systems
syndicate001.com
TG channel
t.me/aisyndicate001
Syndicate Ultimate · 4 systems · 1 bundle
· 1 payment · lifetime access
Gold · FX · NQ/ES · private systems
syndicate001.com
TG channel
t.me/aisyndicate001
Отказ от ответственности
Информация и публикации не предназначены для предоставления и не являются финансовыми, инвестиционными, торговыми или другими видами советов или рекомендаций, предоставленных или одобренных TradingView. Подробнее читайте в Условиях использования.