Neural Engine - Adaptive Trendline Detection System [Algoativi]
The Problem
Two problems, actually.
Problem 1: Trendlines are subjective. Two traders draw two different lines on the same chart — different anchors, different angles, different conclusions. And most of the time, those lines break five minutes later. Automated trendline indicators aren't much better. They either draw too many lines (noise) or lock onto a single timeframe and miss the bigger picture.
Problem 2: Candles are noisy. Standard candlestick charts show every tick of market noise. Even Heikin-Ashi candles still carry significant chop on lower timeframes. Traders spend more time filtering visual noise than reading actual momentum.
The Approach
Neural Engine solves both problems in one overlay.
For structure: It scans three timeframe ranges — Micro (50 bars), Mid (100 bars), and Macro (250 bars) — and for each range, identifies the mathematically optimal trendline by locating the highest-scoring anchor point and calculating the slope that respects the most price touches. Then it picks the winner. The engine scores each trendline by how many quality touches it has — weighted by proximity, not just contact — and auto-selects the strongest candidate. You get the single most relevant support line and resistance line on your chart at any given moment.
For momentum: It replaces standard candles with double-smoothed Heikin-Ashi — OHLC data is smoothed, transformed into HA, then smoothed again. The result is a clean, color-coded momentum signal that strips away bar-to-bar noise and shows you the actual directional flow. Choose between EMA (balanced) or HMA (low-lag) smoothing depending on your trading style.
No manual drawing. No stale lines. No candle noise. The entire chart updates live.
Pine Script v6. No repainting. Stocks, crypto, forex.
━━━━━━━━━━━━━━━━━━━━━━━━━━━━━━━━━━━━━━━━━━
TL;DR
━━━━━━━━━━━━━━━━━━━━━━━━━━━━━━━━━━━━━━━━━━
Neural Trendlines — auto-detected support and resistance from 3 timeframe ranges, scored by touch quality
Channel Visualization — filled zones between the main trendline and its edge, showing the full price channel
Channel State Detection — Full Bull, Full Bear, Converging (squeeze), or Diverging (expansion)
Structure Analysis — 25-state regime-aware label combining channel direction with price position
Smoothed Heikin-Ashi — double-smoothed momentum candles replacing standard chart noise with clean directional flow
Two Smoothing Modes — EMA (balanced) or HMA (low-lag) — choose your responsiveness
10-Stage Momentum Engine — FLIP ACTIVE to WARMING to RISING to GAINING to SURGING to MAX POWER to COOLING to SLOWING to FADING to FLIP SOON
Momentum Power Gauge — 10-block visual bar showing real-time momentum strength (0-100%)
Golden/Death Cross — daily-anchored SMA crossover detection, accurate on any chart timeframe
Market Regime — auto-classified: Bull Breakout, Bear Breakdown, Resistance Test, Support Test, or Ranging
Distance Tracking — live percentage distance to both resistance and support lines
Dashboard — theme-aware table (header + 7 data rows) with tooltips on every cell
18 Alert Conditions — all pre-formatted as Discord webhook JSON embeds
Pine Screener Export — 14 numeric plots for watchlist scanning
Show/Hide Trendlines — keep dashboard data without visual overlay
Scanner Mode — disables all visuals for screener compatibility
22 inputs · 8 groups · Adaptive dark/light theme · Minimal default footprint
━━━━━━━━━━━━━━━━━━━━━━━━━━━━━━━━━━━━━━━━━━
HOW THE NEURAL ENGINE WORKS
This is the core of the indicator. Here's the process:
Step 1 — Anchor Detection
For each of three lookback ranges (short, medium, long), the engine finds the highest high (for resistance) and lowest low (for support) as the anchor point.
Step 2 — Slope Optimization
From the anchor, it scans up to 300 historical bars, calculating the slope from the anchor to each bar's high (resistance) or low (support). For resistance, it selects the steepest valid slope that stays above all price action. For support, the flattest valid slope that stays below.
Step 3 — Touch Scoring
The engine then walks forward from the anchor, measuring how close price comes to each trendline. Touches within the sensitivity threshold contribute a quality score — the closer the touch, the higher the score. This isn't a binary "touched or didn't" system; it's a gradient that rewards precision.
Step 4 — Winner Selection
With Auto-Select enabled, the engine compares all three timeframe candidates and picks the one with the highest touch score. This means the indicator adapts — in a trending market it might favor the Macro line, while in a consolidation it might switch to Micro.
The result: one resistance trendline and one support trendline, each the strongest candidate across all three ranges.
CHANNEL VISUALIZATION
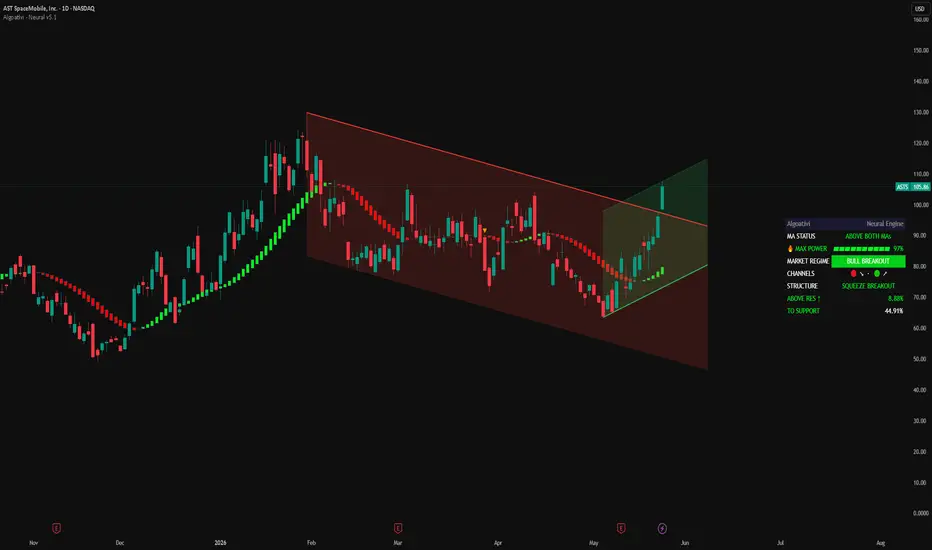
Each trendline isn't just a line — it's a channel. The engine calculates the maximum price deviation from the main trendline and draws a parallel edge line at that distance. The space between is filled with a transparent color, creating a visual corridor.
Red channel = resistance zone (price ceiling)
Green channel = support zone (price floor)
The filled channels make it immediately obvious where price is trading relative to the structural boundaries — and how wide those boundaries are. The wider channel (dominant) is listed first in the dashboard. Use the Show Auto Trendlines toggle to hide lines while keeping dashboard data.
CHANNEL STATE + STRUCTURE — What's Happening Right Now?
The engine classifies the combined direction of both channels into four base patterns:
Uptrend — Both resistance and support are rising. Higher highs + higher lows.
Downtrend — Both channels falling. Lower highs + lower lows.
Squeeze — Resistance falling while support rising. The channels are converging — a breakout setup.
Expanding — Resistance rising while support falling. Volatility widening.
But the pattern alone isn't enough. The STRUCTURE row in the dashboard combines the channel direction with your current price position to produce a regime-aware label. For example:
Price breaks above resistance in a downtrend → REVERSAL BREAKOUT
Price breaks above resistance in an uptrend → TREND BREAKOUT
Price breaks above resistance in a squeeze → SQUEEZE BREAKOUT
Price approaches support in a downtrend → DOWNTREND · NEAR SUP
Ranging inside an uptrend with wide resistance → UPTREND · WIDE RES
25 total states. The label tells you not just what the channels are doing, but what that means given where price is right now.
10-STAGE MOMENTUM ENGINE — Know Exactly Where You Are in the Cycle
This is v5's headline feature. The dashboard Momentum row combines a status label with a 10-block power gauge, giving you an instant read on momentum health.
The 10 stages — Build phase (6 stages):
🟢🔴 FLIP ACTIVE — Direction just changed. First candle of new color appeared.
▲ WARMING / ▼ DRIPPING — Early small bodies. Momentum is starting but weak.
▲ RISING / ▼ FALLING — Trend developing. Bodies growing, direction confirmed.
▲ GAINING / ▼ DUMPING — Momentum accelerating. Bodies getting larger fast.
▲▼ SURGING — Dominant move. Strong sustained bodies.
🔥 MAX POWER — Peak bodies. Maximum momentum strength.
Decay phase (4 stages):
▬ COOLING — First body shrink detected. Momentum may be peaking.
▬ SLOWING — Two consecutive shrinking bodies. Trend losing steam.
⚠ FADING — Three or more shrinks. Significant decay underway.
⚠ FLIP SOON — Exhaustion zone. Power below 40% with sustained shrinkage. Reversal imminent.
How the gauge works:
The power score (0-100%) compares current body size to the 20-bar average. Average-sized bodies score around 67%. Exceptional bodies hit 100%. The first bar after a flip starts at a low score and builds naturally as the new direction establishes itself. A 10% shrink threshold prevents micro-fluctuations from triggering false decay signals.
SMOOTHED HEIKIN-ASHI — Your Chart, Denoised
When you add Neural Engine to your chart, the standard candlesticks are replaced with double-smoothed Heikin-Ashi candles. The difference is immediate: instead of a noisy mess of green and red bars flipping back and forth, you see clean momentum phases — sustained green runs during uptrends, sustained red during downtrends, with clear transition points.
How it works:
The engine takes raw OHLC data, smooths it using your chosen filter, applies the Heikin-Ashi transformation (which already averages price action), then smooths the result a second time. This double-pass process eliminates the bar-to-bar noise that makes standard candles hard to read, while preserving the actual trend direction.
Two smoothing modes:
EMA — Exponential Moving Average smoothing. Balanced responsiveness and stability. Good default for swing trading.
HMA — Hull Moving Average smoothing. Significantly reduces lag compared to EMA. Faster turns, earlier momentum flip detection. Better for active trading and shorter timeframes.
GOLDEN CROSS / DEATH CROSS — Daily-Anchored
A classic but effective signal: the 50-period SMA crossing over (Golden Cross) or under (Death Cross) the 150-period SMA. Both lengths are configurable.
Why daily-anchored? A 50 SMA on a 1-hour chart covers about 2 trading days — that's not a Golden Cross in any meaningful sense. Neural Engine always calculates the cross signal from daily timeframe data, regardless of your chart timeframe. On a 1H, 4H, or 15m chart, you still see the real daily-level Golden/Death Cross status — not a noisy intraday approximation.
Labels appear directly on the chart at crossover points. Recent crosses cause the dashboard row to flash, drawing your attention to the event.
MARKET REGIME — Where Is Price Right Now?
The engine continuously classifies price position relative to the neural trendlines:
Bull Breakout — Price is above the resistance trendline. The ceiling has been broken.
Bear Breakdown — Price is below the support trendline. The floor has given way.
Resistance Test — Price is within the approach threshold of resistance. Decision point.
Support Test — Price is within the approach threshold of support. Warning zone (displayed in orange).
Ranging — Price is between both trendlines. No immediate structural pressure.
DASHBOARD — Everything at a Glance
A compact, theme-aware table (header + 7 data rows) that displays:
MA Status — Golden Cross or Death Cross (daily-anchored), with flash highlight on recent crosses
Momentum — 10-stage label + power gauge bar with real-time percentage
Market Regime — Current price position classification with color-coded background
Channels — Resistance + support direction arrows, wider (dominant) channel listed first
Structure — Dynamic regime-aware context label (25 states)
To Resistance — Live percentage distance to the resistance trendline
To Support — Live percentage distance to the support trendline
Every row has a detailed tooltip. The dashboard auto-detects your TradingView theme (dark or light) and adjusts colors accordingly. Manual override available in settings.
ALERT SYSTEM — 18 Conditions, Discord-Ready
Every alert fires on confirmed bars only and outputs a Discord webhook JSON embed with $-formatted prices:
Structural:
Bull Breakout — Price broke above neural resistance
Bear Breakdown — Price broke below neural support
Approaching Resistance — Price within warning zone
Approaching Support — Price within warning zone
Trend:
Golden Cross — Fast MA crossed over Slow MA (daily)
Death Cross — Fast MA crossed under Slow MA (daily)
Momentum — Flip Active:
🟢 Bull Flip Active — HA direction shifted to bullish
🔴 Bear Flip Active — HA direction shifted to bearish
Momentum — Stage Transitions:
🔥 Max Power Reached — Peak momentum, bodies at maximum strength
▬ Momentum Cooling — First body shrink detected
⚠ Momentum Fading — 3+ shrinking bodies, significant decay
⚠ Flip Soon — Momentum exhausted, reversal imminent
Channel:
Full Bull Channel — Both channels now rising
Full Bear Channel — Both channels now falling
Channel Converging — Squeeze forming
Channel Diverging — Expansion forming
Each embed includes: Price, Timeframe, MA Status, Momentum Stage with Power %, Regime, Channel Directions, and a clickable chart link.
PINE SCREENER — Scan Your Watchlist
Enable Scanner Mode to disable all visuals and expose 14 numeric plots:
MA Trend (1 = Golden, -1 = Death)
Momentum (1 = Bullish, -1 = Bearish)
Regime (2 = Breakout, -2 = Breakdown, 1/-1 = Near Support/Resistance, 0 = Ranging)
Resistance Direction (1 = Rising, -1 = Falling)
Support Direction (1 = Rising, -1 = Falling)
Channel State (2 = Full Bull, -2 = Full Bear, 1 = Converging, -1 = Diverging)
MA Cross Signal (1 = Golden Cross this bar, -1 = Death Cross)
HA Flip Signal (1 = Bullish flip, -1 = Bearish flip)
Distance to Resistance %
Distance to Support %
HA Power (0-100)
Momentum Stage (1-6 bull build, -1 to -6 bear build, 7-10 decay)
Shrink Count (consecutive shrinking bodies)
Direction Bars (bars in current HA direction)
CONFIGURATION REFERENCE
Main Configuration — Scanner Mode toggle, lookback limit
Neural Engine — Auto-select toggle, touch sensitivity
Momentum (Smoothed HA) — Candle visibility, smoothing length, EMA vs HMA
Trend (Golden/Death Cross) — MA line visibility, fast/slow lengths
Alert Settings — Approach warning threshold, HA Power flip threshold
Visual Colors — Neural resistance/support colors, trendline visibility
Candle Style — HA body, wick, and border colors
Dashboard Interface — Visibility, position, size, theme (Auto/Dark/Light)
QUICK START — 30 Seconds to Running
1. Add the indicator — it loads with smoothed HA candles, neural trendlines, and the dashboard.
2. Watch the Momentum row — it tells you exactly where you are in the cycle.
3. Watch the Market Regime row — it tells you where price sits relative to the neural lines.
4. STRUCTURE row shows the full context — "SQUEEZE BREAKOUT" means price broke out of a converging channel.
5. Distance rows show how close you are to key levels.
6. Set alerts: "Bull Flip Active" + "Flip Soon" for momentum, "Bull Breakout" for structure.
This indicator is a technical analysis tool, not financial advice. No signal or trendline should be interpreted as a recommendation to buy, sell, or hold any financial instrument. Always conduct your own analysis and manage risk according to your personal circumstances.
© Algoativi · Neural Engine v5 · All rights reserved
Trendlines are subjective — two traders, two different lines, two different conclusions. Candles are noisy — every tick of market noise makes it harder to read actual momentum. Neural Engine solves both in one overlay.
The engine uses a proprietary multi-layer scoring model to identify the strongest support and resistance on your chart. Lines adapt as the market evolves. Standard candles are replaced with momentum-filtered visualization that strips noise and shows clean directional flow.
No manual drawing. No stale lines. No candle noise. Pine Script v6. No repainting. Stocks, crypto, forex.
━━━━━━━━━━━━━━━━━━━━━━━━━━━━━━━━━━━━━━━━━━
FEATURES
━━━━━━━━━━━━━━━━━━━━━━━━━━━━━━━━━━━━━━━━━━
Neural Trendlines — auto-selected from multiple candidates across different horizons
Price Channels — filled zones showing the full structural corridor
10-Stage Momentum Engine — know exactly where you are in the cycle
Power Gauge — 10-block bar showing real-time momentum strength (0-100%)
25-State Structure Labels — channel direction + price position = context-aware reading
Golden/Death Cross — daily-anchored, accurate on any timeframe
Market Regime — Breakout, Breakdown, Resistance Test, Support Test, Ranging
Dashboard — 7 data rows, tooltips, auto dark/light theme
18 Discord-Ready Alerts — pre-formatted webhook JSON embeds
Pine Screener — 14 plots for watchlist scanning
━━━━━━━━━━━━━━━━━━━━━━━━━━━━━━━━━━━━━━━━━━
NEURAL TRENDLINES + CHANNELS
The engine evaluates structural significance across multiple timeframe ranges, scores each candidate, and selects the most validated lines. One resistance, one support — the most relevant boundaries on your chart right now.
Each line extends into a filled channel showing the full price corridor. Red = resistance zone. Green = support zone. The wider (dominant) channel is listed first in the dashboard. Toggle visibility while keeping all data active.
STRUCTURE — 25 States
Channel direction + price position = one clear label.
SQUEEZE BREAKOUT — Broke out of converging channels
REVERSAL BREAKOUT — Broke resistance in a downtrend
DOWNTREND · NEAR SUP — Falling, approaching support
25 states total — you see what the structure means for you right now.
10-STAGE MOMENTUM ENGINE
The Momentum row shows status + power gauge — instant read on cycle position.
Build: 🟢🔴 FLIP ACTIVE → WARMING/DRIPPING → RISING/FALLING → GAINING/DUMPING → SURGING → 🔥 MAX POWER
Decay: ▬ COOLING → ▬ SLOWING → ⚠ FADING → ⚠ FLIP SOON
Power gauge (0-100%) uses a proprietary scoring model. Starts low after a flip, builds naturally, decays when bodies shrink.
MOMENTUM CANDLES
Proprietary multi-pass smoothing replaces noisy candles with clean momentum phases. Two modes: balanced (swing trading) or low-lag (active trading).
GOLDEN/DEATH CROSS
Daily-anchored — on any chart timeframe, you see the real daily cross status, not a noisy intraday approximation.
DASHBOARD
MA Status · Momentum + Gauge · Market Regime · Channels · Structure · Distance to Resistance · Distance to Support
Theme-aware. Tooltips on every row.
18 ALERTS — Discord-Ready
Structure: Bull Breakout · Bear Breakdown · Approaching Resistance · Approaching Support
Trend: Golden Cross · Death Cross
Momentum: Bull/Bear Flip Active · Max Power · Cooling · Fading · Flip Soon
Channel: Full Bull · Full Bear · Converging · Diverging
All confirmed-bar only. Each embed includes price, timeframe, regime, momentum stage, power %, and chart link.
PINE SCREENER
Scanner Mode exposes 14 numeric plots — scan your watchlist for flips, breakouts, and power thresholds across hundreds of symbols.
QUICK START
1. Add the indicator — everything loads automatically
2. Watch Momentum — it tells you where you are in the cycle
3. Watch Regime — it tells you where price sits vs key levels
4. Set alerts: "Bull Flip Active" + "Flip Soon" + "Bull Breakout"
This indicator is a technical analysis tool, not financial advice. Always conduct your own analysis and manage risk according to your personal circumstances.
© Algoativi · Neural Engine v5 · All rights reserved
Trendlines are subjective. Candles are noisy. Neural Engine solves both in one overlay.
The engine identifies the strongest support and resistance on your chart using a proprietary analysis model. Standard candles are replaced with filtered momentum visualization — clean directional flow instead of bar-to-bar noise.
No manual drawing. No stale lines. Pine Script v6. No repainting.
━━━━━━━━━━━━━━━━━━━━━━━━━━━━━━━━━━━━━━━━━━
FEATURES
━━━━━━━━━━━━━━━━━━━━━━━━━━━━━━━━━━━━━━━━━━
Neural Trendlines — the strongest support and resistance on your chart, always current
Price Channels — visual corridors showing the full structural width
Momentum Engine — real-time momentum lifecycle tracking with power gauge
Structure Labels — context-aware market state in one glance
Smart MA Status — dynamic support/resistance classification with cross detection
Market Regime — instant classification of your price position
Dashboard — compact, theme-aware, with detailed tooltips
Discord-Ready Alerts — pre-formatted webhook embeds
Pine Screener — scan your watchlist for signals across hundreds of symbols
━━━━━━━━━━━━━━━━━━━━━━━━━━━━━━━━━━━━━━━━━━
NEURAL TRENDLINES + CHANNELS
One resistance line. One support line. Always the most relevant boundaries on your chart. The engine continuously adapts as market conditions change — no manual adjustment needed.
Each line extends into a filled channel. Red = resistance corridor. Green = support corridor. Toggle visibility while keeping all dashboard data active.
STRUCTURE LABELS
The dashboard reads your chart and produces a single context-aware label that tells you what the current structure means for your position — breakouts, tests, squeezes, and trend direction combined into one clear reading.
MOMENTUM ENGINE
The Momentum row shows exactly where you are in the current cycle — from the first signal of a new direction through peak strength to exhaustion. A live power gauge gives you an instant visual read.
MOMENTUM CANDLES
Proprietary candle processing replaces noise with clean momentum phases. Two responsiveness modes available depending on your trading style.
SMART MA STATUS
Goes beyond static Golden/Death Cross labels. The MA row dynamically shows whether the moving averages are providing support, acting as resistance, or if price is trading between them — giving you actionable context instead of stale signals.
DASHBOARD
Seven data rows covering MA status, momentum, regime, channels, structure, and distance to key levels. Auto dark/light theme. Detailed tooltips on every row.
ALERTS
Structural, trend, momentum, and channel alerts — all confirmed-bar only. Every alert outputs a formatted Discord webhook embed with price, timeframe, and full market context.
PINE SCREENER
Scanner Mode lets you scan your entire watchlist for momentum shifts, breakouts, and regime changes simultaneously.
QUICK START
1. Add the indicator — everything loads automatically
2. Watch the Momentum row — it tells you where you are in the cycle
3. Watch the Regime row — it shows where price sits relative to key levels
4. Set alerts for the signals that matter to your strategy
This indicator is a technical analysis tool, not financial advice. Always conduct your own analysis and manage risk according to your personal circumstances.
© Algoativi · Neural Engine v5 · All rights reserved
═══════════════════════════════════════
🆕 NEW IN v5.1 — DASHBOARD UI PARITY UPDATE
═══════════════════════════════════════
📊 Footer Bar (Wide) Layout
A new horizontal 7-column status strip designed for placement at Bottom Center as a chart footer. Same information matrix, same color logic, same context tooltips as the Vertical layout — restructured horizontally so the chart breathes. The momentum column renders the 10-state gauge bar (▰▰▰▰▰▱▱▱▱▱) on a second line for visual parity.
📍 9 Placement Slots
Expanded from 5 to all 9 TradingView position slots (added Top Center, Middle Center, Middle Left, Bottom Center). Position changes apply live through the dynamic table-rebuild pattern — no remove-and-re-add required.
📏 5 Text Sizes
Expanded from 3 to 5 size levels (Tiny / Small / Normal / Large / Huge). Labels and values scale through a proportional hierarchy so visual weight is preserved at every scale — from multi-chart grids to 4K presentations.
📐 Stack Offset (Rows)
Pushes the dashboard away from its anchor edge by N empty rows (0-20). Resolves the "two indicators overlap at the same corner" problem when running Neural alongside other Algoativi indicators. Direction auto-resolves from anchor context: Top/Middle anchors push DOWN, Bottom anchor pushes UP. Works on BOTH Vertical and Footer Bar layouts.
💡 Show Hover Tooltips Toggle
Disable the tooltip overlays for a cleaner read, or keep them on (default) for the educational context.
🛠️ Updated Defaults
Position: Bottom Right (was Middle Right) · Size: Normal (was Small). Out-of-the-box experience aligned with the rest of the Algoativi suite.
Full Light / Dark support.
═══════════════════════════════════════
THE FULL ENGINE
═══════════════════════════════════════
ADAPTIVE TRENDLINE SYSTEM
A multi-resolution scoring framework scans Micro / Mid / Macro timeframe horizons in parallel, ranks every candidate trendline by a context-conditioned quality score, and auto-promotes the highest-confidence pair to the active chart. The scoring blends touch-quality forensics, age-weighted respect history, and a regime-aware proximity filter. Updates in real-time. No manual re-drawing.
CHANNEL VISUALIZATION
The space between detected support and resistance is rendered as a transparent corridor whose fill responds to live touch events — red on resistance interactions, green on support interactions — for instant visual context on where price sits relative to the active channel and which side is being tested.
10-STATE HIERARCHICAL POWER ENGINE
A hierarchical ensemble that decomposes every Heikin-Ashi candle into a discrete power state by synthesizing body-decay dynamics, range-normalized expansion signature, and a context-conditioned volatility envelope. Stage progression maps to either build paths (Flip Active → Warming → Rising → Gaining → Surging → Max Power) or decay paths (Cooling → Slowing → Fading → Flip Soon) depending on the inferred trend regime. Result: a high-resolution momentum reading that exposes WHICH stage of strength you are actually entering at — not just whether the candle reads bullish.
DOUBLE-SMOOTHED HEIKIN-ASHI
A two-pass filter: OHLC is smoothed, transformed into Heikin-Ashi, then smoothed again through a configurable kernel. Two smoothing modes: EMA (balanced response curve) or HMA (low-latency for faster regime detection).
STRUCTURE ANALYSIS
25 context-aware labels generated from a state-machine that cross-references channel direction with relative price position. Sample outputs: Squeeze Breakout, Reversal Breakout, Resistance Test, Support Test, Ranging Inside Channel. Each label is the resolved verdict of a multi-condition rule — not a single-indicator readout.
DAILY-ANCHORED GOLDEN / DEATH CROSS
Moving-average crossover signals computed on the Daily timeframe through a request.security pipeline and projected onto the active chart regardless of current resolution — so a Golden Cross detected on the Daily structure is visible on the 1H, 15m, or 5m view of the same asset.
MARKET REGIME CLASSIFIER (5 STATES)
A regime-detection layer that classifies the active asset into one of five operational states: Bull Breakout, Bear Breakdown, Resistance Test, Support Test, Ranging. Regime conditions are derived from the joint state of trend, structure, and momentum — not from a single threshold.
ALERT SYSTEM
16 pre-configured alert conditions covering structural events (breakouts, approaching levels), trend events (Golden / Death Cross), momentum-state transitions (flips, max power, cooling, fading), and channel-state shifts (full bull, full bear, converging, diverging). All alerts fire as Discord-ready JSON embeds with full context payloads.
DASHBOARD
Theme-aware status table displaying the synthesized output of every engine: MA crossover state, momentum stage with a visual 10-block power gauge, market regime, channel state, structure label, and proximity percentages to active levels. Two layouts: Vertical (default 8-row stacked) or Footer Bar (horizontal 7-column status strip).
UI & WORKSPACE
- 9 placement slots (full TradingView position grid)
- 5 text-size levels with proportional hierarchy scaling
- 3 themes (Auto / Dark / Light)
- Stack Offset for clean co-existence with other Algoativi indicators
SCANNER MODE
Exports 14 numeric plots for Pine Screener scanning across watchlists — momentum stage, channel state, distance-to-level percentages, breakout flags.
DEFAULT BEHAVIOR
- Dashboard Layout: Vertical
- Position: Bottom Right
- Size: Normal
- Theme: Auto-detect chart background
LIMITATIONS
- Trendlines are auto-resolved by the scoring framework — manual override is not provided
- Uses request.security with lookahead=barmerge.lookahead_off (no lookahead bias)
- Past performance does not guarantee future results
This indicator is a technical analysis tool, not financial advice. No signal or trendline should be interpreted as a recommendation to buy, sell, or hold any financial instrument.
This update fixes channel rendering during TradingView's Bar Replay, and prepares Neural to power the new Trinity Wave.
🌊 Trinity-ready — Neural now exports its Momentum Stage cleanly so it can feed the new Trinity Convergence Wave inside the MCC. Link the Neural Momentum source there to fuse all three Algoat.TV engines into one conviction read.
🛠️ Bar Replay fix — the auto-trendline channel fills no longer flicker or disappear when stepping through Bar Replay. The colored channel now stays solid across replay frames.
✅ Stability-focused — no change to signals, momentum stages, trendline detection, or dashboard behavior on live charts.
The Neural Engine's adaptive trendline detection, 10-stage momentum reading, market-regime classification and theme-aware dashboard are all unchanged — just smoother in replay and ready to feed the Trinity Wave.
A reading, not financial advice (NFA).
Neural sees what price is actually doing: it auto-draws the support and resistance, trendlines and channels the market respects, and reads the full lifecycle of momentum through a smoothed Heikin-Ashi engine — so you know not just the direction, but whether a move still has fuel. For swing trading, day trading and investing on stocks, ETFs, crypto, forex and futures, on any timeframe.
The momentum core — double-smoothed Heikin-Ashi
Momentum is read through Heikin-Ashi candles smoothed twice (EMA or HMA), which strips intra-bar noise and reveals continuation and exhaustion earlier and more cleanly than raw candles — a momentum oscillator that reads like price.
10-stage momentum lifecycle
A staged power engine tracks a move through its whole life — Flip Active → Warming → Rising → Gaining → Surging → Max Power → Cooling → Slowing → Fading → Flip Soon — with a 0–100% power gauge. Direction alone is not enough; this tells you if momentum is building, peaking or decaying.
Adaptive auto-trendlines
Neural auto-computes candidate trendlines from swing pivots across Micro / Mid / Macro ranges and auto-selects the one price is actually respecting, with Strict / Balanced / Loose sensitivity. It ends the "where does the line go?" debate — the trendline is drawn for you.
Channel state — builds a price channel and classifies it (Rising, Falling, Converging, Diverging, Full Bull, Full Bear), so you instantly read whether structure is tightening, expanding or trending.
Support / resistance & market regime — a distance-to-line read powers "approaching support / resistance" proximity alerts; a market-regime label (Bull Breakout / Bear Breakdown / Resistance Test / Support Test / Ranging) frames the backdrop; and a daily-anchored Golden Cross / Death Cross keeps a lower-timeframe chart aligned with the Daily trend.
Screener & dashboard — filter the built-in Pine Screener by Price, Volume, Dollar Volume, Market Cap, daily % and 7-day %; a theme-aware dashboard (Vertical or Footer-Bar, 9 positions, 5 text sizes) with Discord-webhook alerts.
Every output is a reading, not an instruction.
For research and educational use only. Not financial advice (NFA). Past performance does not guarantee future results.
Скрипт с ограниченным доступом
Только пользователи, одобренные автором, могут получить доступ к этому скрипту. Вам нужно отправить запрос и получить разрешение на его использование. Обычно доступ предоставляется после оплаты. Для получения подробной информации следуйте инструкциям автора ниже или свяжитесь с Algoativi напрямую.
TradingView НЕ рекомендует оплачивать или использовать скрипт, если вы полностью не доверяете его автору и не понимаете, как он работает. Вы также можете найти бесплатные, открытые альтернативы в наших скриптах сообщества.
Инструкции от автора

Three indicators. Three roles. One complete system.
Free trial, all included , no paywall → Algoat.tv
Community → reddit.com/r/AlgoatTV/
Отказ от ответственности
Скрипт с ограниченным доступом
Только пользователи, одобренные автором, могут получить доступ к этому скрипту. Вам нужно отправить запрос и получить разрешение на его использование. Обычно доступ предоставляется после оплаты. Для получения подробной информации следуйте инструкциям автора ниже или свяжитесь с Algoativi напрямую.
TradingView НЕ рекомендует оплачивать или использовать скрипт, если вы полностью не доверяете его автору и не понимаете, как он работает. Вы также можете найти бесплатные, открытые альтернативы в наших скриптах сообщества.
Инструкции от автора
Three indicators. Three roles. One complete system.
Free trial, all included , no paywall → Algoat.tv
Community → reddit.com/r/AlgoatTV/