OPEN-SOURCE SCRIPT
Wyckoff Range Atlas [CandleChasers]
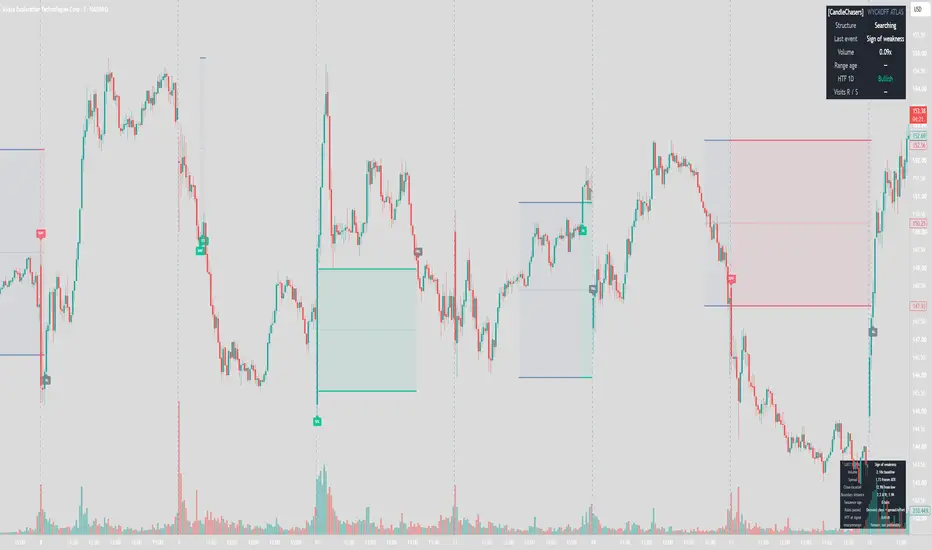
Wyckoff Range Atlas is an indicator for studying trading ranges, price-and-volume events, breakouts, and subsequent retests through a rules-based interpretation of Wyckoff concepts.
Automatic and manual trading ranges
Automatic mode identifies ranges with low directional efficiency, suitable width relative to ATR, and distinct visits to support and resistance. Adjacent candles at a boundary count as one visit; a new visit requires a configurable number of bars outside the boundary zone.
Once a range is detected, its support, resistance, and ATR scale are frozen. This gives subsequent events a consistent reference. Manual mode lets you enter your own support, resistance, and activation time for discretionary analysis.
Wyckoff event labels
- SPR? — Spring candidate: a shallow move below support that closes strongly back inside the range.
- UT? — Upthrust candidate: a shallow move above resistance that closes weakly back inside the range.
- TEST — Sweep test: a later higher low or lower high with narrow spread and reduced volume in Required mode.
- SOS — Sign of strength: a qualified upward breakout with wide spread, a strong closing location, and elevated relative volume in Required mode.
- SOW — Sign of weakness: the corresponding qualified downward breakout.
- LPS? / LPSY? — Retest candidates: a quiet, narrow-spread retest of the broken boundary within a defined window.
- FAIL — Failed breakout: a close sufficiently back through the previously broken boundary.
Question marks identify interpretive candidates. A spring is not required before a qualified breakout. These patterns do not establish institutional positioning or guarantee a subsequent move.
Higher-timeframe context
The dashboard includes optional context from completed higher-timeframe candles. It compares the last completed close with an EMA and checks the EMA's direction to display Bullish, Bearish, or Mixed context. This provides a broader trend reference without suppressing chart-timeframe signals. Select a context timeframe higher than the chart timeframe.
Transparent signal diagnostics
A separate panel preserves the latest signal's relative volume, spread/ATR, closing location, boundary distance, sequence age, rule summary, and higher-timeframe context. These measurements explain the detected pattern; they are not a confidence percentage or a probability of success.
Alerts
Ten named alert conditions cover range detection and the labeled event types. Configurable detailed JSON alerts include event names, symbol, timeframe, boundary prices, signal-bar timestamps, volume and spread measurements, and context.
For simple notifications, choose a named condition and Once Per Bar Close. For detailed payloads, choose **Any alert() function call** and enable your preferred event families in the indicator settings. New-range JSON notifications are disabled by default. Recreate alerts after changing the indicator's code or settings.
Signal timing and volume modes
Signals commit at candle close and appear on the detection bar. Labels are not moved backward. Higher-timeframe context uses completed candles. The live volume value in the status dashboard can change during the open candle; last-signal diagnostics remain fixed until the next signal.
Required volume is the default and applies volume qualification to relevant patterns. Price only mode bypasses volume requirements and provides a reduced price-pattern interpretation. Feed volume may represent traded volume or tick activity, depending on the instrument.
Getting started
1. Add the indicator to a standard candlestick chart.
2. Start with Automatic mode and the default settings, then adjust the range lookback and event thresholds to the structure you are studying.
3. For Manual mode, enter support below resistance and select when those levels became known.
4. Set a higher context timeframe if using the context dashboard.
5. Choose named alerts or the detailed JSON alert workflow.
Scope and limitations
Wyckoff Range Atlas is an indicator only. It places no orders and reports no strategy backtest results. It implements selected range events rather than full A–E phase classification, Point and Figure price targets, or proof of accumulation/distribution. Defaults are starting values rather than universally optimized settings.
Price patterns can fail, feed revisions and chart-history changes can affect calculations, and manual levels selected with hindsight can distort historical interpretation. No verified win rate, profitability, or trading edge is claimed.
Signal reference
| Label | Interpretation | Additional requirement |
| --- | --- | --- |
| SPR? | Support sweep and reclaim | Shallow penetration, strong close, inside range |
| UT? | Resistance sweep and rejection | Shallow penetration, weak close, inside range |
| TEST | Test following a sweep | Higher low/lower high, narrow spread, lower volume |
| SOS | Upward range breakout | Wide spread, close near high, relative volume threshold |
| SOW | Downward range breakout | Wide spread, close near low, relative volume threshold |
| LPS? | Former resistance tested as support | Quiet, narrow candle within retest window |
| LPSY? | Former support tested as resistance | Quiet, narrow candle within retest window |
| FAIL | Qualified breakout invalidated | Close 0.5 frozen ATR back through boundary |
Defaults and tuning
Defaults are starting values, not optimized parameters. No market or timeframe performance claims have been established.
- Range lookback: 60 bars. Longer values seek broader structures.
- Maximum directional efficiency: 0.25. Lower values demand less net directional movement relative to total close-to-close travel.
- Range width: 2–12 prior ATR. Range boundaries use high/low extremes.
- Boundary visits: two per side. A new visit requires three consecutive bars outside that boundary zone; adjacent candles count as one visit. The boundary zone is capped at 20% of range width to prevent overlapping zones.
- Volume baseline: previous 20 bars, excluding the signal bar.
- Breakout volume: at least 1.3 times baseline.
- Test volume: at most baseline, and below the original sweep bar for sweep tests.
- Maximum sweep: one frozen ATR. Deeper shakeouts are intentionally excluded.
- Sweep test window: 15 bars. Breakout retest window: 25 bars.
- Range expiry: 180 bars after detection, including breakout tracking.
Required volume is the default. Missing/zero current volume suppresses volume-qualified pattern events; range detection and breakout-failure notifications do not require volume. Price only mode bypasses every volume test and must be described as a reduced price-pattern interpretation. Tick volume is a feed-specific activity proxy, not centralized traded volume.
How the state machine behaves
The detector retains one range at a time. Automatic discovery requires distinct boundary visits. Manual mode bypasses discovery filters and activates one user-defined range. Automatic ranges begin when prior-bar discovery requirements pass; manual ranges begin at the selected activation time once ATR is available. Sweep candidates can occur within a range; a new accepted sweep replaces the pending sweep test. Qualified breaks enter upward/downward breakout tracking. A sweep is not required before a breakout. Each qualified breakout can have one labeled retest. An unqualified escape beyond one frozen ATR ends range tracking without issuing SOS/SOW. After failure or escape, Automatic mode resumes discovery on a later bar. On expiry, a new qualifying automatic range can be detected on the same bar. Manual mode does not automatically reactivate. This is not an A–E phase classifier.
The range plots begin one bar after detection to prevent line connections between separate ranges. No boundaries are drawn backward across their discovery window. Historical event labels remain, subject to TradingView's 300-label retention limit.
Research basis
Wyckoff's supply/demand and effort/result principles inform the volume/spread filters. Springs, upthrusts, tests, SOS/SOW, and LPS/LPSY inform event sequencing. This indicator does not implement Point and Figure cause/effect counts, price objectives, relative-strength stock selection, or full schematic recognition. Range age is not a substitute for a Point and Figure target.
Automatic and manual trading ranges
Automatic mode identifies ranges with low directional efficiency, suitable width relative to ATR, and distinct visits to support and resistance. Adjacent candles at a boundary count as one visit; a new visit requires a configurable number of bars outside the boundary zone.
Once a range is detected, its support, resistance, and ATR scale are frozen. This gives subsequent events a consistent reference. Manual mode lets you enter your own support, resistance, and activation time for discretionary analysis.
Wyckoff event labels
- SPR? — Spring candidate: a shallow move below support that closes strongly back inside the range.
- UT? — Upthrust candidate: a shallow move above resistance that closes weakly back inside the range.
- TEST — Sweep test: a later higher low or lower high with narrow spread and reduced volume in Required mode.
- SOS — Sign of strength: a qualified upward breakout with wide spread, a strong closing location, and elevated relative volume in Required mode.
- SOW — Sign of weakness: the corresponding qualified downward breakout.
- LPS? / LPSY? — Retest candidates: a quiet, narrow-spread retest of the broken boundary within a defined window.
- FAIL — Failed breakout: a close sufficiently back through the previously broken boundary.
Question marks identify interpretive candidates. A spring is not required before a qualified breakout. These patterns do not establish institutional positioning or guarantee a subsequent move.
Higher-timeframe context
The dashboard includes optional context from completed higher-timeframe candles. It compares the last completed close with an EMA and checks the EMA's direction to display Bullish, Bearish, or Mixed context. This provides a broader trend reference without suppressing chart-timeframe signals. Select a context timeframe higher than the chart timeframe.
Transparent signal diagnostics
A separate panel preserves the latest signal's relative volume, spread/ATR, closing location, boundary distance, sequence age, rule summary, and higher-timeframe context. These measurements explain the detected pattern; they are not a confidence percentage or a probability of success.
Alerts
Ten named alert conditions cover range detection and the labeled event types. Configurable detailed JSON alerts include event names, symbol, timeframe, boundary prices, signal-bar timestamps, volume and spread measurements, and context.
For simple notifications, choose a named condition and Once Per Bar Close. For detailed payloads, choose **Any alert() function call** and enable your preferred event families in the indicator settings. New-range JSON notifications are disabled by default. Recreate alerts after changing the indicator's code or settings.
Signal timing and volume modes
Signals commit at candle close and appear on the detection bar. Labels are not moved backward. Higher-timeframe context uses completed candles. The live volume value in the status dashboard can change during the open candle; last-signal diagnostics remain fixed until the next signal.
Required volume is the default and applies volume qualification to relevant patterns. Price only mode bypasses volume requirements and provides a reduced price-pattern interpretation. Feed volume may represent traded volume or tick activity, depending on the instrument.
Getting started
1. Add the indicator to a standard candlestick chart.
2. Start with Automatic mode and the default settings, then adjust the range lookback and event thresholds to the structure you are studying.
3. For Manual mode, enter support below resistance and select when those levels became known.
4. Set a higher context timeframe if using the context dashboard.
5. Choose named alerts or the detailed JSON alert workflow.
Scope and limitations
Wyckoff Range Atlas is an indicator only. It places no orders and reports no strategy backtest results. It implements selected range events rather than full A–E phase classification, Point and Figure price targets, or proof of accumulation/distribution. Defaults are starting values rather than universally optimized settings.
Price patterns can fail, feed revisions and chart-history changes can affect calculations, and manual levels selected with hindsight can distort historical interpretation. No verified win rate, profitability, or trading edge is claimed.
Signal reference
| Label | Interpretation | Additional requirement |
| --- | --- | --- |
| SPR? | Support sweep and reclaim | Shallow penetration, strong close, inside range |
| UT? | Resistance sweep and rejection | Shallow penetration, weak close, inside range |
| TEST | Test following a sweep | Higher low/lower high, narrow spread, lower volume |
| SOS | Upward range breakout | Wide spread, close near high, relative volume threshold |
| SOW | Downward range breakout | Wide spread, close near low, relative volume threshold |
| LPS? | Former resistance tested as support | Quiet, narrow candle within retest window |
| LPSY? | Former support tested as resistance | Quiet, narrow candle within retest window |
| FAIL | Qualified breakout invalidated | Close 0.5 frozen ATR back through boundary |
Defaults and tuning
Defaults are starting values, not optimized parameters. No market or timeframe performance claims have been established.
- Range lookback: 60 bars. Longer values seek broader structures.
- Maximum directional efficiency: 0.25. Lower values demand less net directional movement relative to total close-to-close travel.
- Range width: 2–12 prior ATR. Range boundaries use high/low extremes.
- Boundary visits: two per side. A new visit requires three consecutive bars outside that boundary zone; adjacent candles count as one visit. The boundary zone is capped at 20% of range width to prevent overlapping zones.
- Volume baseline: previous 20 bars, excluding the signal bar.
- Breakout volume: at least 1.3 times baseline.
- Test volume: at most baseline, and below the original sweep bar for sweep tests.
- Maximum sweep: one frozen ATR. Deeper shakeouts are intentionally excluded.
- Sweep test window: 15 bars. Breakout retest window: 25 bars.
- Range expiry: 180 bars after detection, including breakout tracking.
Required volume is the default. Missing/zero current volume suppresses volume-qualified pattern events; range detection and breakout-failure notifications do not require volume. Price only mode bypasses every volume test and must be described as a reduced price-pattern interpretation. Tick volume is a feed-specific activity proxy, not centralized traded volume.
How the state machine behaves
The detector retains one range at a time. Automatic discovery requires distinct boundary visits. Manual mode bypasses discovery filters and activates one user-defined range. Automatic ranges begin when prior-bar discovery requirements pass; manual ranges begin at the selected activation time once ATR is available. Sweep candidates can occur within a range; a new accepted sweep replaces the pending sweep test. Qualified breaks enter upward/downward breakout tracking. A sweep is not required before a breakout. Each qualified breakout can have one labeled retest. An unqualified escape beyond one frozen ATR ends range tracking without issuing SOS/SOW. After failure or escape, Automatic mode resumes discovery on a later bar. On expiry, a new qualifying automatic range can be detected on the same bar. Manual mode does not automatically reactivate. This is not an A–E phase classifier.
The range plots begin one bar after detection to prevent line connections between separate ranges. No boundaries are drawn backward across their discovery window. Historical event labels remain, subject to TradingView's 300-label retention limit.
Research basis
Wyckoff's supply/demand and effort/result principles inform the volume/spread filters. Springs, upthrusts, tests, SOS/SOW, and LPS/LPSY inform event sequencing. This indicator does not implement Point and Figure cause/effect counts, price objectives, relative-strength stock selection, or full schematic recognition. Range age is not a substitute for a Point and Figure target.
Скрипт с открытым кодом
В истинном духе TradingView, создатель этого скрипта сделал его открытым исходным кодом, чтобы трейдеры могли проверить и убедиться в его функциональности. Браво автору! Вы можете использовать его бесплатно, но помните, что перепубликация кода подчиняется нашим Правилам поведения.

Отказ от ответственности
Информация и публикации не предназначены для предоставления и не являются финансовыми, инвестиционными, торговыми или другими видами советов или рекомендаций, предоставленных или одобренных TradingView. Подробнее читайте в Условиях использования.
Скрипт с открытым кодом
В истинном духе TradingView, создатель этого скрипта сделал его открытым исходным кодом, чтобы трейдеры могли проверить и убедиться в его функциональности. Браво автору! Вы можете использовать его бесплатно, но помните, что перепубликация кода подчиняется нашим Правилам поведения.
Отказ от ответственности
Информация и публикации не предназначены для предоставления и не являются финансовыми, инвестиционными, торговыми или другими видами советов или рекомендаций, предоставленных или одобренных TradingView. Подробнее читайте в Условиях использования.