Обновлено
StonkGame MTF MA Trend Table
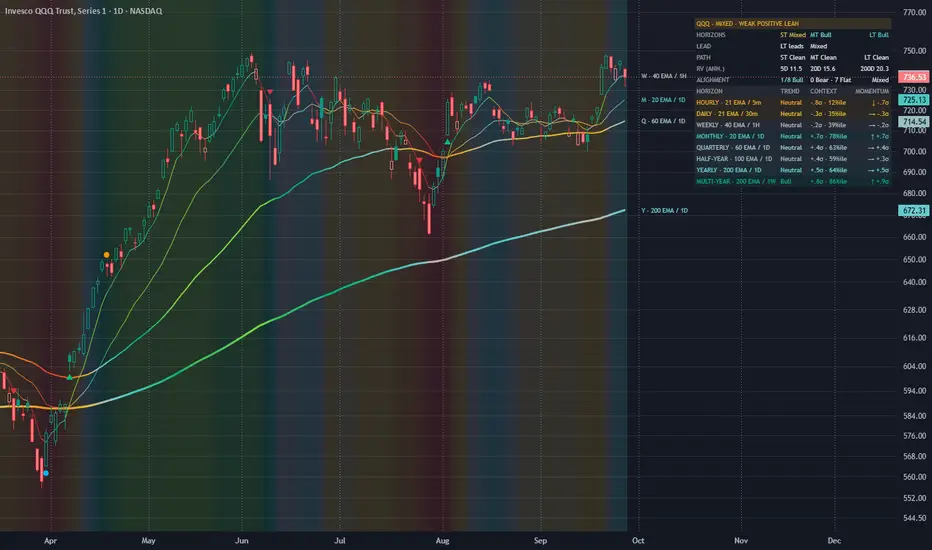
Overview
StonkGame MTF MAs & Trend Table is designed to provide objective market context across multiple trading horizons, regardless of the timeframe you're trading.
Rather than trying to predict future price, it measures where price sits relative to trend, whether that trend is strengthening or weakening, how well different horizons agree with one another, and whether today's move is typical or historically unusual.
The goal is to keep the bigger picture in view, whether you're trading a 1-minute chart or managing a long-term position.
How It Works
Each horizon (Hourly, Daily, Weekly, Monthly, Quarterly, Half-Year, Yearly and Multi-Year) can use its own timeframe and moving average length. Every horizon evaluates:
Price relative to its moving average
Trend direction and momentum
Historical Z-score
Historical percentile
Adaptive normalization
Those measurements are combined into an objective view of trend quality, momentum and cross-horizon alignment.
Adaptive Normalization
Markets don't all behave the same. A 2% move in SPY doesn't carry the same meaning as a 2% move in Bitcoin, crude oil or gold.
Instead of comparing raw price movement, each horizon compares today's reading against that market's own history using up to 1,000 valid observations. If less history exists, the script automatically uses the largest reliable sample available. If there isn't enough data to produce meaningful statistics, it displays N/A rather than potentially misleading values.
Reading the Dashboard
The dashboard is designed to answer four questions:
Trend: Is the market structurally bullish, bearish or mixed?
Momentum: Is that trend strengthening or weakening?
Context: How unusual is the current move relative to its own history?
Alignment: Are different trading horizons telling the same story?
The Setup Score summarizes overall trend quality, consistency and market structure. Higher scores generally reflect cleaner, more aligned conditions, while lower scores suggest greater conflict or uncertainty.
Notes
This indicator is descriptive, not predictive. Strong trends can stay extended, and statistically extreme readings are not automatic buy or sell signals. They are intended to provide context alongside price action, risk management and your own trading process.
Changing the moving average type, timeframe, horizon lengths or normalization settings changes how the market is evaluated. There is no universally correct configuration—choose settings that match your trading horizon and objectives.
StonkGame MTF MAs & Trend Table is designed to provide objective market context across multiple trading horizons, regardless of the timeframe you're trading.
Rather than trying to predict future price, it measures where price sits relative to trend, whether that trend is strengthening or weakening, how well different horizons agree with one another, and whether today's move is typical or historically unusual.
The goal is to keep the bigger picture in view, whether you're trading a 1-minute chart or managing a long-term position.
How It Works
Each horizon (Hourly, Daily, Weekly, Monthly, Quarterly, Half-Year, Yearly and Multi-Year) can use its own timeframe and moving average length. Every horizon evaluates:
Price relative to its moving average
Trend direction and momentum
Historical Z-score
Historical percentile
Adaptive normalization
Those measurements are combined into an objective view of trend quality, momentum and cross-horizon alignment.
Adaptive Normalization
Markets don't all behave the same. A 2% move in SPY doesn't carry the same meaning as a 2% move in Bitcoin, crude oil or gold.
Instead of comparing raw price movement, each horizon compares today's reading against that market's own history using up to 1,000 valid observations. If less history exists, the script automatically uses the largest reliable sample available. If there isn't enough data to produce meaningful statistics, it displays N/A rather than potentially misleading values.
Reading the Dashboard
The dashboard is designed to answer four questions:
Trend: Is the market structurally bullish, bearish or mixed?
Momentum: Is that trend strengthening or weakening?
Context: How unusual is the current move relative to its own history?
Alignment: Are different trading horizons telling the same story?
The Setup Score summarizes overall trend quality, consistency and market structure. Higher scores generally reflect cleaner, more aligned conditions, while lower scores suggest greater conflict or uncertainty.
Notes
This indicator is descriptive, not predictive. Strong trends can stay extended, and statistically extreme readings are not automatic buy or sell signals. They are intended to provide context alongside price action, risk management and your own trading process.
Changing the moving average type, timeframe, horizon lengths or normalization settings changes how the market is evaluated. There is no universally correct configuration—choose settings that match your trading horizon and objectives.
Информация о релизе
Reworked the table to make the main readout easier to scan. The ticker and most relevant market condition now appear together at the top.Added short, medium and long-term context for trend quality, realized volatility and where the timeframes agree or conflict.
Added three line colour options: a full heatmap, a two-colour version with colours you choose, and the original horizon colours.
Added optional direction-shift and extreme-recovery markers. Each has its own setting and is off by default.
Made the table more opaque by default, with a setting to adjust how much of the chart shows through.
Updated the default moving averages and timeframes to match the intended hourly through multi-year horizons.
Expanded the setting descriptions so it’s clearer what each control changes.
Информация о релизе
Reorganized the settings to follow the table from top to bottom.Added a compact view that shows just the ticker and main market readout.
Added controls to show or hide each horizon row individually.
Removed the separate Trend Structure section.
Added 5D, 20D and 200D annualized realized volatility to the Market Readout, quoted as plain numbers.
Clarified the headline warnings so ATR readings aren’t confused with realized volatility.
Информация о релизе
Reorganized the settings to follow the table from top to bottom.Added a compact view with just the ticker and main market readout.
Added controls to show or hide each horizon row.
Removed the separate Trend Structure section.
Added 5D, 20D and 200D realized volatility to compare recent movement with the longer-term baseline.
Added optional colours for equities: red when shorter-term realized volatility is higher, green when it’s lower.
Clarified which warnings use ATR and which readings use realized volatility.

Отказ от ответственности
Информация и публикации не предназначены для предоставления и не являются финансовыми, инвестиционными, торговыми или другими видами советов или рекомендаций, предоставленных или одобренных TradingView. Подробнее читайте в Условиях использования.
Отказ от ответственности
Информация и публикации не предназначены для предоставления и не являются финансовыми, инвестиционными, торговыми или другими видами советов или рекомендаций, предоставленных или одобренных TradingView. Подробнее читайте в Условиях использования.