OPEN-SOURCE SCRIPT
Dual Volume Profile
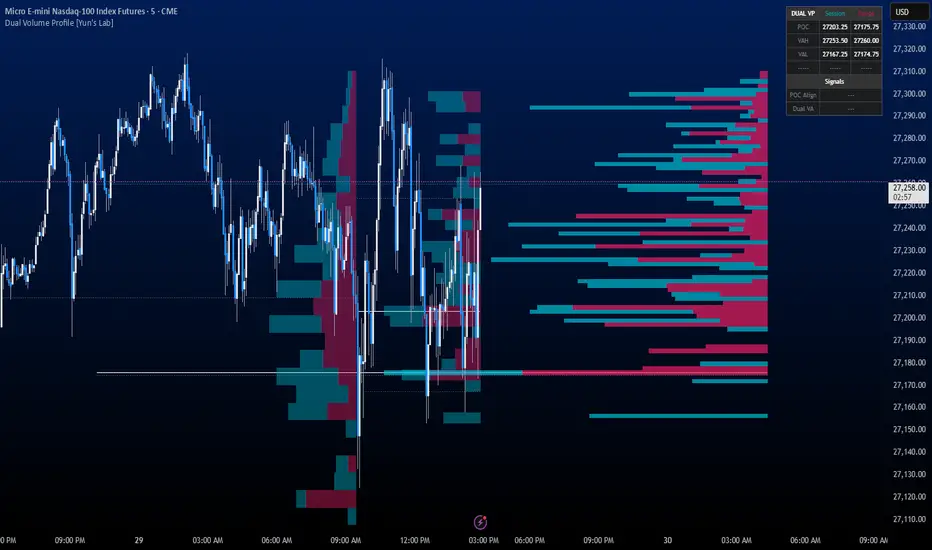
Dual Volume Profile overlays two independent volume profiles on your chart simultaneously: a session profile built from intraday trading hours, and a composite range profile built from a configurable lookback period. Comparing the two reveals whether short-term auction activity is confirming or diverging from the broader volume structure.
Inspired by TradingView's built-in VRVP and SVP HD indicators, the Dual VP combines both concepts into a single overlay — pairing the structural range view of VRVP with the per-session granularity of SVP HD — and adds a signal layer that detects when the two profiles agree or diverge.
Session profile
Builds a volume-at-price histogram for each trading session using your selected hours — CME RTH, NYSE RTH, Full Globex, or a custom window. Up to 5 historical sessions are displayed alongside the current developing session. Each session shows its own POC, VAH, and VAL.
Range profile
Builds a composite volume-at-price histogram across a configurable lookback (default 200 bars). This acts as a multi-session structural view similar to TradingView's built-in VRVP, positioned in the right margin of the chart. POC, VAH, and VAL are drawn across the full range.
Signals
The indicator generates three optional signals based on the relationship between the session and range profiles:
POC Alignment — fires when the session POC and range POC converge within a user-defined threshold, indicating agreement on fair value between the short-term and structural auctions.
Dual VA Breakout — fires when price trades above both value area highs or below both value area lows simultaneously, suggesting a directional move accepted by both timeframes.
VA Divergence — fires when the session's value area midpoint shifts significantly away from the range's value area midpoint, indicating the developing session is repricing relative to the composite structure.
How to use it
Add the indicator and select the session type matching your instrument. The session profiles draw inline over price history; the range profile anchors to the right margin. Use the info table (top-right by default) to monitor both sets of levels and active signals at a glance. Session transparency is adjustable so the histograms don't obscure candles.
Settings overview
Session Type, Sessions to Show, Session Bar Thickness, Session Transparency, Lookback Bars, Right Margin Offset, Price Rows (session and range independently), Value Area %, Up/Down volume colors, POC/VA line visibility, and signal thresholds for alignment, breakout, and divergence.
Inspired by TradingView's built-in VRVP and SVP HD indicators, the Dual VP combines both concepts into a single overlay — pairing the structural range view of VRVP with the per-session granularity of SVP HD — and adds a signal layer that detects when the two profiles agree or diverge.
Session profile
Builds a volume-at-price histogram for each trading session using your selected hours — CME RTH, NYSE RTH, Full Globex, or a custom window. Up to 5 historical sessions are displayed alongside the current developing session. Each session shows its own POC, VAH, and VAL.
Range profile
Builds a composite volume-at-price histogram across a configurable lookback (default 200 bars). This acts as a multi-session structural view similar to TradingView's built-in VRVP, positioned in the right margin of the chart. POC, VAH, and VAL are drawn across the full range.
Signals
The indicator generates three optional signals based on the relationship between the session and range profiles:
POC Alignment — fires when the session POC and range POC converge within a user-defined threshold, indicating agreement on fair value between the short-term and structural auctions.
Dual VA Breakout — fires when price trades above both value area highs or below both value area lows simultaneously, suggesting a directional move accepted by both timeframes.
VA Divergence — fires when the session's value area midpoint shifts significantly away from the range's value area midpoint, indicating the developing session is repricing relative to the composite structure.
How to use it
Add the indicator and select the session type matching your instrument. The session profiles draw inline over price history; the range profile anchors to the right margin. Use the info table (top-right by default) to monitor both sets of levels and active signals at a glance. Session transparency is adjustable so the histograms don't obscure candles.
Settings overview
Session Type, Sessions to Show, Session Bar Thickness, Session Transparency, Lookback Bars, Right Margin Offset, Price Rows (session and range independently), Value Area %, Up/Down volume colors, POC/VA line visibility, and signal thresholds for alignment, breakout, and divergence.
Скрипт с открытым кодом
В истинном духе TradingView, создатель этого скрипта сделал его открытым исходным кодом, чтобы трейдеры могли проверить и убедиться в его функциональности. Браво автору! Вы можете использовать его бесплатно, но помните, что перепубликация кода подчиняется нашим Правилам поведения.

Отказ от ответственности
Информация и публикации не предназначены для предоставления и не являются финансовыми, инвестиционными, торговыми или другими видами советов или рекомендаций, предоставленных или одобренных TradingView. Подробнее читайте в Условиях использования.
Скрипт с открытым кодом
В истинном духе TradingView, создатель этого скрипта сделал его открытым исходным кодом, чтобы трейдеры могли проверить и убедиться в его функциональности. Браво автору! Вы можете использовать его бесплатно, но помните, что перепубликация кода подчиняется нашим Правилам поведения.
Отказ от ответственности
Информация и публикации не предназначены для предоставления и не являются финансовыми, инвестиционными, торговыми или другими видами советов или рекомендаций, предоставленных или одобренных TradingView. Подробнее читайте в Условиях использования.