OPEN-SOURCE SCRIPT
15M Gap + BOS Supply & Demand Zones
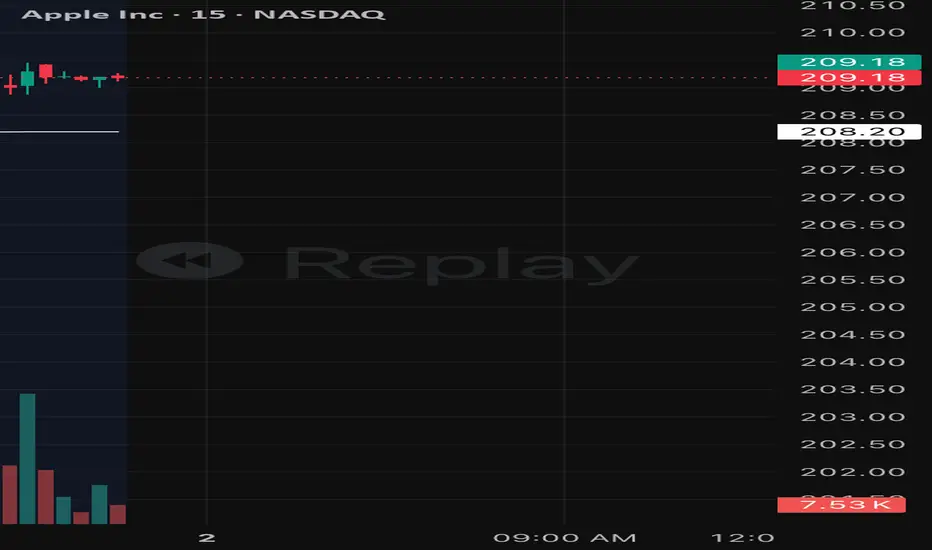
This indicator is designed to identify potential supply and demand zones based on a 15-minute gap and break of structure strategy.
For bullish setups, the indicator looks for a 15-minute bullish gap followed by a bullish break of structure. It then finds and boxes the most recent bearish candle before the bullish move, marking it as a green demand zone.
For bearish setups, the indicator looks for a 15-minute bearish gap followed by a bearish break of structure. It then finds and boxes the most recent bullish candle before the bearish move, marking it as a red supply zone.
The zones extend to the right to help identify possible future reaction areas where price may return, reject, or continue from.
For bullish setups, the indicator looks for a 15-minute bullish gap followed by a bullish break of structure. It then finds and boxes the most recent bearish candle before the bullish move, marking it as a green demand zone.
For bearish setups, the indicator looks for a 15-minute bearish gap followed by a bearish break of structure. It then finds and boxes the most recent bullish candle before the bearish move, marking it as a red supply zone.
The zones extend to the right to help identify possible future reaction areas where price may return, reject, or continue from.
Скрипт с открытым кодом
В истинном духе TradingView, создатель этого скрипта сделал его открытым исходным кодом, чтобы трейдеры могли проверить и убедиться в его функциональности. Браво автору! Вы можете использовать его бесплатно, но помните, что перепубликация кода подчиняется нашим Правилам поведения.

Отказ от ответственности
Информация и публикации не предназначены для предоставления и не являются финансовыми, инвестиционными, торговыми или другими видами советов или рекомендаций, предоставленных или одобренных TradingView. Подробнее читайте в Условиях использования.
Скрипт с открытым кодом
В истинном духе TradingView, создатель этого скрипта сделал его открытым исходным кодом, чтобы трейдеры могли проверить и убедиться в его функциональности. Браво автору! Вы можете использовать его бесплатно, но помните, что перепубликация кода подчиняется нашим Правилам поведения.
Отказ от ответственности
Информация и публикации не предназначены для предоставления и не являются финансовыми, инвестиционными, торговыми или другими видами советов или рекомендаций, предоставленных или одобренных TradingView. Подробнее читайте в Условиях использования.