OPEN-SOURCE SCRIPT
Market Cycle Wave [Gabremoku]
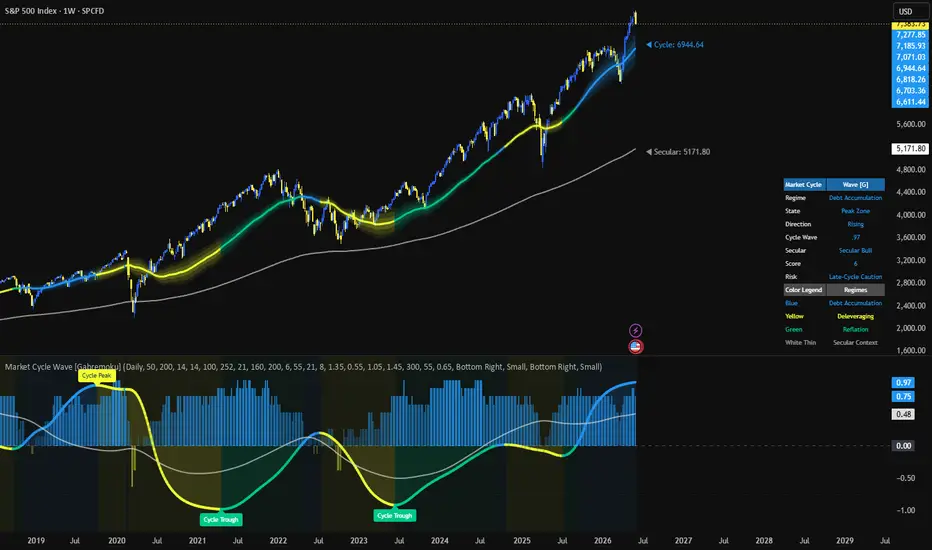
Market Cycle Wave is a price-based cycle indicator built to map broad market phases into a readable oscillator and a price-anchored overlay.
Instead of relying on a single signal, the script combines trend, momentum, volatility, and range-position data into a composite cycle score. That score is normalized and smoothed to create an intermediate Cycle Wave, while a slower Secular line provides broader context.
The script has two main views:
- an oscillator pane with the score histogram, Cycle Wave, Secular baseline, and major Cycle Peak / Cycle Trough labels.
- a price overlay with a cycle line, gradient aura, and a thinner secular context line.
The regime model classifies market conditions into Debt Accumulation, Deleveraging, Reflation, and Transition. The goal is not to generate standalone buy/sell signals, but to help traders read where price may sit inside a broader market cycle structure.
How to use it
This indicator works best on broad indices and diversified equity ETFs, where cycle behavior is usually cleaner than on highly erratic single names.
Typical use:
- Daily chart: monitor intermediate cycle shifts
- Weekly chart: study broader regime transitions
Practical reading:
- A rising blue cycle wave can suggest constructive expansion conditions
- A yellow rollover after a mature advance can suggest a weakening cycle structure
- Deep negative readings followed by green recovery can suggest reflation or post-stress repair
- The secular line helps show whether the shorter cycle is moving with or against the broader backdrop
The dashboard summarizes the current regime, state, direction, score, risk posture, and color legend directly on the chart.
How it works
The cycle model uses eight price-based factors:
- Fast EMA vs slow EMA relationship
- Fast EMA slope
- RSI momentum regime
- RSI extremes
- Position inside the rolling yearly range
- Distance from yearly extremes
- ATR volatility regime
- Price position vs the slow EMA
Each factor contributes to a composite score. That score is then normalized, smoothed, and accumulated over a rolling memory window to build a bounded cycle wave around a midpoint.
A second and slower baseline is built through longer smoothing to represent secular context. This creates two distinct layers:
- Cycle Wave: the intermediate cycle, more reactive to market swings
- Secular Baseline: the broader context, slower and less sensitive
Recent Cycle Peak and Cycle Trough labels are pivot-based, so the latest labels need confirmation from future bars.
Instead of relying on a single signal, the script combines trend, momentum, volatility, and range-position data into a composite cycle score. That score is normalized and smoothed to create an intermediate Cycle Wave, while a slower Secular line provides broader context.
The script has two main views:
- an oscillator pane with the score histogram, Cycle Wave, Secular baseline, and major Cycle Peak / Cycle Trough labels.
- a price overlay with a cycle line, gradient aura, and a thinner secular context line.
The regime model classifies market conditions into Debt Accumulation, Deleveraging, Reflation, and Transition. The goal is not to generate standalone buy/sell signals, but to help traders read where price may sit inside a broader market cycle structure.
How to use it
This indicator works best on broad indices and diversified equity ETFs, where cycle behavior is usually cleaner than on highly erratic single names.
Typical use:
- Daily chart: monitor intermediate cycle shifts
- Weekly chart: study broader regime transitions
Practical reading:
- A rising blue cycle wave can suggest constructive expansion conditions
- A yellow rollover after a mature advance can suggest a weakening cycle structure
- Deep negative readings followed by green recovery can suggest reflation or post-stress repair
- The secular line helps show whether the shorter cycle is moving with or against the broader backdrop
The dashboard summarizes the current regime, state, direction, score, risk posture, and color legend directly on the chart.
How it works
The cycle model uses eight price-based factors:
- Fast EMA vs slow EMA relationship
- Fast EMA slope
- RSI momentum regime
- RSI extremes
- Position inside the rolling yearly range
- Distance from yearly extremes
- ATR volatility regime
- Price position vs the slow EMA
Each factor contributes to a composite score. That score is then normalized, smoothed, and accumulated over a rolling memory window to build a bounded cycle wave around a midpoint.
A second and slower baseline is built through longer smoothing to represent secular context. This creates two distinct layers:
- Cycle Wave: the intermediate cycle, more reactive to market swings
- Secular Baseline: the broader context, slower and less sensitive
Recent Cycle Peak and Cycle Trough labels are pivot-based, so the latest labels need confirmation from future bars.
Скрипт с открытым кодом
В истинном духе TradingView, создатель этого скрипта сделал его открытым исходным кодом, чтобы трейдеры могли проверить и убедиться в его функциональности. Браво автору! Вы можете использовать его бесплатно, но помните, что перепубликация кода подчиняется нашим Правилам поведения.

Отказ от ответственности
Информация и публикации не предназначены для предоставления и не являются финансовыми, инвестиционными, торговыми или другими видами советов или рекомендаций, предоставленных или одобренных TradingView. Подробнее читайте в Условиях использования.
Скрипт с открытым кодом
В истинном духе TradingView, создатель этого скрипта сделал его открытым исходным кодом, чтобы трейдеры могли проверить и убедиться в его функциональности. Браво автору! Вы можете использовать его бесплатно, но помните, что перепубликация кода подчиняется нашим Правилам поведения.
Отказ от ответственности
Информация и публикации не предназначены для предоставления и не являются финансовыми, инвестиционными, торговыми или другими видами советов или рекомендаций, предоставленных или одобренных TradingView. Подробнее читайте в Условиях использования.