[DAOL] Volume Profile Context V2
⏺️ What is it?
[DAOL] Volume Profile Context compares estimated volume distributions across two adjacent completed periods, then monitors closing prices against a frozen Value Area.
It helps answer three questions:
🔹 Has the highest-volume price zone moved upward or downward?
🔹 How much do the two Value Areas overlap?
🔹 Is price holding above, below, or returning inside the latest frozen Value Area?
This indicator estimates volume distribution from chart-timeframe OHLCV bars. It does not use transaction-level volume-at-price, bid/ask data, or order flow.
⏺️ Indicator นี้คืออะไร?
[DAOL] Volume Profile Context เปรียบเทียบการกระจาย Volume โดยประมาณของสองช่วงที่จบแล้ว พร้อมติดตามราคาปิดเทียบกับ Value Area ที่ล็อกไว้
ช่วยตอบ 3 คำถาม:
🔹 โซนราคาที่มี Volume สูงสุดย้ายขึ้นหรือลง?
🔹 Value Area สองช่วงทับซ้อนกันมากแค่ไหน?
🔹 ราคายืนเหนือ ยืนใต้ หรือกลับเข้ามาใน Value Area ล่าสุดแล้ว?
Indicator ใช้การประมาณจากข้อมูล OHLCV ของแท่งใน Timeframe กราฟ ไม่ได้ใช้ข้อมูล Volume รายธุรกรรม ข้อมูล Bid/Ask หรือ Order Flow
⏺️ Why use Volume Profile Context?
🔹 Compares two periods on the same price grid
🔹 Separates changes in volume distribution from price reactions to existing reference levels
🔹 Displays POC migration and Value Area overlap numerically
🔹 Keeps reaction levels fixed between profile updates
🔹 Provides closed-bar alerts with configurable confirmation
A rising POC describes an upward shift in the highest estimated-volume row. It does not, by itself, prove buying pressure or predict further gains.
⏺️ ทำไมต้องใช้?
🔹 เปรียบเทียบสองช่วงบนระดับราคาเดียวกัน
🔹 แยกการเปลี่ยนของโซน Volume ออกจากปฏิกิริยาราคาต่อระดับอ้างอิงเดิม
🔹 แสดงการย้ายของ POC และการทับซ้อนของ Value Area เป็นตัวเลข
🔹 ล็อกระดับสำหรับติดตามราคาจนถึงรอบอัปเดตถัดไป
🔹 มี Alert จากแท่งปิด โดยปรับจำนวนแท่งยืนยันได้
POC ที่ย้ายสูงขึ้นหมายถึงแถวราคาที่มี Volume โดยประมาณสูงสุดย้ายขึ้น ไม่ได้ยืนยันแรงซื้อหรือรับประกันว่าราคาจะขึ้นต่อ
⏺️ How does it work?
By default, the indicator compares:
🔹 Recent Window — the latest completed 100-bar block
🔹 Older Window — the preceding 100-bar block
🔹 Shared Grid — 36 price rows covering the combined high/low range
Both windows use identical price boundaries and histogram scaling.
Profiles refresh every 100 closed bars. After each refresh, the latest POC, VAH, and VAL remain fixed until the next refresh.
This is a completed-block comparison, not a continuously rolling or session-based profile.
⏺️ ทำงานอย่างไร?
ค่าเริ่มต้นเปรียบเทียบ:
🔹 Recent Window — ช่วงล่าสุดที่จบแล้ว 100 แท่ง
🔹 Older Window — ช่วงก่อนหน้าที่ติดกัน 100 แท่ง
🔹 Shared Grid — ระดับราคา 36 แถว ครอบคลุม High–Low ของทั้งสองช่วง
สองช่วงใช้ขอบระดับราคาและสเกล Histogram เดียวกัน
โปรไฟล์อัปเดตทุก 100 แท่งปิด จากนั้น POC, VAH และ VAL ล่าสุดจะคงที่จนถึงรอบถัดไป
จึงเป็นการเปรียบเทียบช่วงที่จบแล้ว ไม่ใช่โปรไฟล์ที่เลื่อนใหม่ทุกแท่งหรือแบ่งตาม Session โดยอัตโนมัติ
⏺️ Key measurements
🔹 POC1 — the center of the row with the highest estimated volume in the recent window
🔹 POC Migration — recent POC minus older POC, expressed in price units and row units
🔹 VAH / VAL — the upper and lower boundaries of the recent Value Area
🔹 Value Area Overlap — intersection width divided by union width of the two Value Areas
🔹 Node2 — a qualifying secondary local volume peak, not a second global POC
🔹 Valley Ratio — the smallest row volume between POC1 and Node2, divided by the weaker peak’s volume
🔹 POC Share — POC row volume divided by total recent-window volume
⏺️ ตัวเลขสำคัญ
🔹 POC1 — ราคากึ่งกลางของแถวที่มี Volume โดยประมาณสูงสุดในช่วงล่าสุด
🔹 POC Migration — POC ล่าสุดลบ POC ช่วงก่อนหน้า แสดงเป็นหน่วยราคาและจำนวนแถว
🔹 VAH / VAL — ขอบบนและขอบล่างของ Value Area ล่าสุด
🔹 Value Area Overlap — ความกว้างส่วนทับซ้อน หารด้วยความกว้างพื้นที่รวมของ Value Area ทั้งสองช่วง
🔹 Node2 — ยอด Volume รองที่ผ่านเกณฑ์ ไม่ใช่ POC หลักอีกตัว
🔹 Valley Ratio — Volume ต่ำสุดในแถวระหว่าง POC1 กับ Node2 เทียบกับ Volume ของยอดที่เล็กกว่า
🔹 POC Share — Volume ในแถว POC เทียบกับ Volume รวมของช่วงล่าสุด
⏺️ How to interpret the measurements
🔹 Positive POC Migration — the highest estimated-volume row moved upward
🔹 Negative POC Migration — it moved downward
🔹 High VA Overlap — the two Value Areas occupy similar price regions
🔹 Low VA Overlap — the two Value Areas occupy less overlapping price regions
🔹 Low Valley Ratio — a deeper estimated-volume gap exists between the two qualified peaks
For example, VA Overlap of 80% describes the overlap of two price intervals. It is not an 80% probability of support, resistance, or trade success.
Node2 is shown only when it meets the selected volume and separation requirements. Some profiles have no qualifying second node.
⏺️ ตีความอย่างไร?
🔹 POC Migration เป็นบวก — แถวที่มี Volume สูงสุดย้ายขึ้น
🔹 POC Migration เป็นลบ — แถวที่มี Volume สูงสุดย้ายลง
🔹 VA Overlap สูง — Value Area สองช่วงอยู่ในบริเวณราคาคล้ายกัน
🔹 VA Overlap ต่ำ — Value Area สองช่วงทับซ้อนกันน้อย
🔹 Valley Ratio ต่ำ — มีช่อง Volume โดยประมาณที่ลึกขึ้นระหว่างยอดทั้งสอง
ตัวอย่าง: VA Overlap 80% หมายถึงสัดส่วนการทับซ้อนของช่วงราคา ไม่ใช่โอกาสเป็นแนวรับ/แนวต้านหรือโอกาสชนะ 80%
Node2 จะแสดงเมื่อผ่านเกณฑ์ขนาด Volume และระยะห่างที่กำหนด บางโปรไฟล์จึงไม่มี Node2
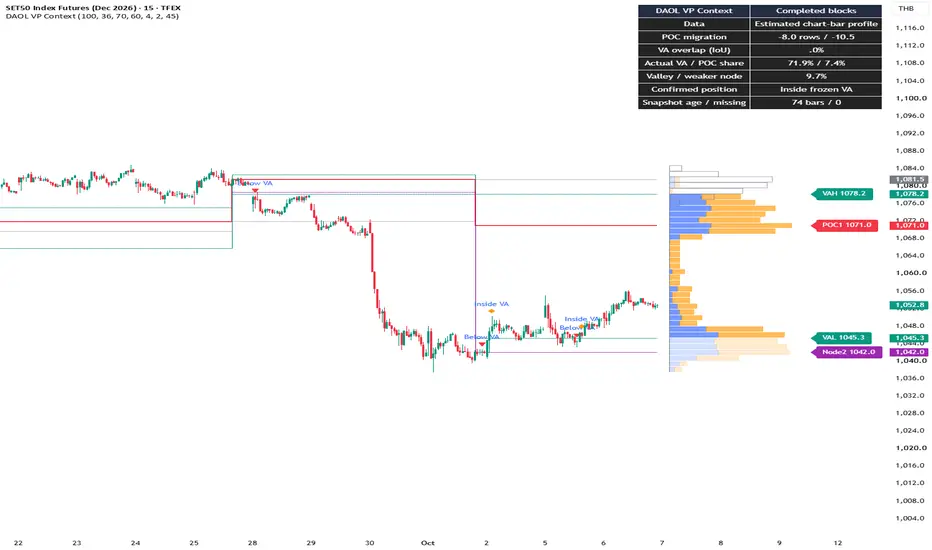
⏺️ How to read the chart
🔹 Blue/orange filled histogram — recent-window up/down volume proxies
🔹 Gray histogram outlines — older-window total estimated volume
🔹 Red line — recent frozen POC1
🔹 Teal lines — recent frozen VAH and VAL
🔹 Gray reference line — older-window POC
🔹 Purple line — qualified Node2, when available
Rows inside the recent Value Area use stronger colors. Rows outside use lighter colors.
The up/down split is a candle-based approximation. It is not actual aggressive buying/selling volume.
⏺️ อ่านกราฟอย่างไร?
🔹 Histogram สีฟ้า/ส้ม — Volume ขึ้น/ลงโดยประมาณของช่วงล่าสุด
🔹 เส้นกรอบ Histogram สีเทา — Volume รวมโดยประมาณของช่วงก่อนหน้า
🔹 เส้นแดง — POC1 ล่าสุดที่ล็อกไว้
🔹 เส้นเขียวอมฟ้า — VAH และ VAL ล่าสุดที่ล็อกไว้
🔹 เส้นอ้างอิงเทา — POC ช่วงก่อนหน้า
🔹 เส้นม่วง — Node2 เมื่อพบจุดที่ผ่านเกณฑ์
แถวใน Value Area ล่าสุดแสดงสีเข้มกว่า ส่วนแถวนอกโซนแสดงสีอ่อนกว่า
การแยกขึ้น/ลงเป็นการประมาณจากแท่งราคา ไม่ใช่ Volume ของคำสั่งซื้อหรือขายเชิงรุกจริง
⏺️ Frozen Value Area reactions
After a profile refresh, the indicator monitors subsequent closes against the fixed VAH and VAL:
🔹 Above VA — consecutive closes above VAH
🔹 Below VA — consecutive closes below VAL
🔹 Returned Inside VA — consecutive closes inside, following a previously confirmed outside position
The default confirmation is 2 consecutive closed bars. A close exactly at VAH or VAL counts as inside.
The refresh bar creates the reference and is not counted as a reaction. Confirmation resets at every profile refresh.
These events describe price location; they are not automatic entry or exit instructions.
⏺️ การติดตามราคากับ Value Area ที่ล็อกไว้
หลังอัปเดตโปรไฟล์ ระบบติดตามราคาปิดของแท่งถัดไปเทียบกับ VAH/VAL ที่คงที่:
🔹 Above VA — ปิดเหนือ VAH ต่อเนื่องตามเกณฑ์
🔹 Below VA — ปิดใต้ VAL ต่อเนื่องตามเกณฑ์
🔹 Returned Inside VA — ปิดกลับเข้าโซน หลังเคยยืนยันสถานะนอกโซนแล้ว
ค่าเริ่มต้นรอ 2 แท่งปิดต่อเนื่อง ราคาปิดตรง VAH หรือ VAL ถือว่าอยู่ภายใน
แท่งอัปเดตใช้สร้างระดับอ้างอิง ไม่ได้นับเป็นปฏิกิริยา และการยืนยันจะเริ่มใหม่ทุกครั้งที่โปรไฟล์อัปเดต
เหตุการณ์เหล่านี้บอกตำแหน่งราคา ไม่ใช่คำสั่ง Entry / Exit โดยอัตโนมัติ
⏺️ Calculation methodology
Volume is distributed across price rows using overlap with each candle’s body and wicks.
🔹 Wick length receives twice the weighting of body length
🔹 Body volume is assigned by candle direction
🔹 Wick volume is split equally between up/down proxies
🔹 Flat candles place their volume in one row, split equally
The Value Area starts at POC and expands contiguously toward the adjacent row with greater volume until it contains at least the target percentage.
Full-row inclusion can exceed the target. Actual coverage is shown in the dashboard. Zero-volume gaps can be included during expansion.
This method can differ from TradingView’s built-in Volume Profile calculations.
⏺️ วิธีคำนวณ
กระจาย Volume ไปยังแต่ละแถวตามระยะทับซ้อนกับ Body และ Wick ของแท่งราคา
🔹 ความยาว Wick ได้รับน้ำหนักสองเท่าของความยาว Body
🔹 Volume ส่วน Body แบ่งตามทิศทางแท่ง
🔹 Volume ส่วน Wick แบ่งขึ้น/ลงเท่ากัน
🔹 แท่งแบนวาง Volume ในแถวราคาเดียวและแบ่งเท่ากัน
Value Area เริ่มจาก POC แล้วขยายต่อเนื่องไปยังแถวข้างเคียงที่มี Volume มากกว่า จนรวมได้อย่างน้อยเปอร์เซ็นต์เป้าหมาย
การรวมทั้งแถวอาจทำให้เกินเป้าหมาย จึงแสดงเปอร์เซ็นต์จริงใน Dashboard และอาจรวมแถวที่ไม่มี Volume เพื่อขยายผ่านช่องว่าง
วิธีนี้อาจให้ผลต่างจาก Volume Profile มาตรฐานของ TradingView
⏺️ Default settings and alignment
🔹 Bars per Window — 100
🔹 Price Rows — 36
🔹 Value Area Target — 70%
🔹 Node2 Minimum Volume — 60% of POC row volume
🔹 Node2 Minimum Separation — 4 rows
🔹 Reaction Confirmation — 2 closed bars
Two full windows are required before the first comparison.
By default, block counting starts at the first loaded chart bar. Loading more history can change block alignment. An explicit Block Anchor Time can provide more consistent alignment when that time remains within loaded history.
⏺️ ค่าเริ่มต้นและการแบ่งช่วง
🔹 Bars per Window — ช่วงละ 100 แท่ง
🔹 Price Rows — 36 แถว
🔹 Value Area Target — 70%
🔹 Node2 Minimum Volume — 60% ของ Volume แถว POC
🔹 Node2 Minimum Separation — ห่างอย่างน้อย 4 แถว
🔹 Reaction Confirmation — 2 แท่งปิด
ต้องมีข้อมูลครบสองช่วงก่อนแสดงการเปรียบเทียบครั้งแรก
ค่าเริ่มต้นนับช่วงจากแท่งแรกที่โหลด การโหลดประวัติเพิ่มอาจเปลี่ยนการแบ่งช่วง หากต้องการความสอดคล้องมากขึ้น ให้ตั้ง Block Anchor Time ที่ยังอยู่ในประวัติกราฟที่โหลด
⏺️ Alerts
🔹 Confirmed above frozen VA
🔹 Confirmed below frozen VA
🔹 Returned inside frozen VA
🔹 Any confirmed value-position change
Alerts occur on confirmed position changes rather than on every bar.
Create an alert in TradingView and select “Once Per Bar Close.” Recreate alerts after changing the indicator’s inputs or source code.
⏺️ การแจ้งเตือน
🔹 Confirmed above frozen VA — ยืนยันเหนือ Value Area
🔹 Confirmed below frozen VA — ยืนยันใต้ Value Area
🔹 Returned inside frozen VA — ยืนยันการกลับเข้า Value Area
🔹 Any confirmed value-position change — การเปลี่ยนตำแหน่งที่ยืนยันทุกประเภท
แจ้งเมื่อสถานะยืนยันเปลี่ยน ไม่ได้แจ้งทุกแท่ง
สร้าง Alert ใน TradingView และเลือก “Once Per Bar Close” หากเปลี่ยน Input หรือโค้ด ให้สร้าง Alert ใหม่
⏺️ Suitable applications
Use standard time-based candlestick charts with meaningful, sufficiently continuous volume data.
For TFEX evaluation, SET50 Index Futures and Gold Online Futures are suggested starting points. Choose the actively traded contract month and keep session settings consistent.
These are proposed testing applications, not claims of validated performance. Check how the data feed handles volume, missing bars, and contract changes.
⏺️ การประยุกต์ใช้งาน
ใช้กับกราฟแท่งเทียนตามเวลาที่มีข้อมูล Volume เหมาะสมและต่อเนื่องเพียงพอ
สำหรับการทดลองใน TFEX สามารถเริ่มจาก SET50 Index Futures และ Gold Online Futures โดยเลือกเดือนสัญญาที่มีการซื้อขายหนาแน่น และใช้การตั้งค่า Session ให้สอดคล้องกัน
เป็นข้อเสนอสำหรับทดลอง ไม่ใช่ผลยืนยันประสิทธิภาพ ควรตรวจการแสดง Volume แท่งที่ข้อมูลหาย และการเปลี่ยนสัญญาของฟีดที่ใช้
⏺️ Development and attribution
This version extends the user-supplied [DAOL] Volume Profile v5 baseline. Its body/wick allocation approach is retained in redesigned functions with safer handling of flat candles and zero-length segments.
The added workflow includes shared-grid window comparison, POC migration, Value Area overlap, secondary-node context, frozen reference levels, and closed-bar reaction alerts.
The supplied legacy header retains an MPL 2.0 notice but does not identify the original author. Exact upstream authorship has not been established.
Related public baseline precedent:
Volume Profile / Fixed Range by LonesomeTheBlue

Concept definitions and calculation context:
TradingView — Volume profile indicators: basic concepts
tradingview.com/support/solutions/43000502040-volume-profile-indicators-basic-concepts/
No claim is made that Volume Profile or all underlying concepts are new. References do not imply endorsement.
⏺️ การพัฒนาและอ้างอิง
เวอร์ชันนี้ต่อยอดจาก [DAOL] Volume Profile v5 ที่ผู้ใช้ส่งมา โดยคงแนวทางแบ่ง Volume ตาม Body/Wick และออกแบบฟังก์ชันใหม่ให้รองรับแท่งแบนกับส่วนราคาที่มีความยาวเป็นศูนย์
ส่วนที่เพิ่มคือการเปรียบเทียบสองช่วงบนกริดเดียวกัน การย้ายของ POC การทับซ้อนของ Value Area บริบทของยอดรอง ระดับอ้างอิงที่ล็อกไว้ และ Alert จากราคาปิด
ส่วนหัวโค้ดฐานมีประกาศ MPL 2.0 แต่ไม่ระบุชื่อผู้เขียน จึงยังยืนยันผู้เขียนต้นฉบับไม่ได้ แหล่งอ้างอิงด้านบนระบุแนวคิดและงานพื้นฐานที่เกี่ยวข้อง ไม่ได้หมายถึงการรับรองจากผู้เขียนเหล่านั้น
⏺️ Limitations and disclaimer
🔹 Estimated chart-bar volume distribution is not exact transaction-level volume-at-price.
🔹 Up/down proxies do not identify actual buyers, sellers, or “smart money.”
🔹 Results depend on row count, timeframe, block alignment, and the volume feed.
🔹 Missing volume or zero-total-volume windows disable context and alerts for that snapshot.
🔹 Frozen levels can become stale between updates; snapshot age is displayed.
🔹 The histogram shows only the latest completed snapshot. It is not a historical developing-profile reconstruction.
🔹 Numerical checks have been completed, but TradingView compilation, runtime performance, and real-market validation remain pending for this version.
🔹 For educational and informational purposes only. It does not constitute investment advice or guarantee trading results.
⏺️ ข้อจำกัดและคำชี้แจง
🔹 เป็นการประมาณ Volume จากแท่งกราฟ ไม่ใช่ Volume รายราคาจากธุรกรรมจริง
🔹 สีขึ้น/ลงไม่ได้ระบุผู้ซื้อ ผู้ขาย หรือ Smart Money
🔹 จำนวนแถว Timeframe การแบ่งช่วง และแหล่งข้อมูล Volume มีผลต่อผลลัพธ์
🔹 หาก Volume ขาดหายหรือช่วงใดมี Volume รวมเป็นศูนย์ จะปิดบริบทและ Alert ของ Snapshot นั้น
🔹 ระดับที่ล็อกไว้อาจล้าสมัยระหว่างรอบ จึงแสดงอายุ Snapshot
🔹 Histogram แสดง Snapshot ล่าสุดที่จบแล้ว ไม่ใช่การสร้างโปรไฟล์ระหว่างทางย้อนหลัง
🔹 ตรวจสูตรเชิงตัวเลขแล้ว แต่ยังรอการ Compile ตรวจความเร็วบน TradingView และทดสอบกับตลาดจริง
🔹 ใช้เพื่อการศึกษาและประกอบการวิเคราะห์ ไม่ถือเป็นคำแนะนำการลงทุนหรือการรับประกันผลลัพธ์
[DAOL] Volume Profile Context compares estimated volume distributions across two adjacent completed periods, then monitors closing prices against a frozen Value Area.
It helps answer three questions:
🔹 Has the highest-volume price zone moved upward or downward?
🔹 How much do the two Value Areas overlap?
🔹 Is price holding above, below, or returning inside the latest frozen Value Area?
This indicator estimates volume distribution from chart-timeframe OHLCV bars. It does not use transaction-level volume-at-price, bid/ask data, or order flow.
⏺️ Indicator นี้คืออะไร?
[DAOL] Volume Profile Context เปรียบเทียบการกระจาย Volume โดยประมาณของสองช่วงที่จบแล้ว พร้อมติดตามราคาปิดเทียบกับ Value Area ที่ล็อกไว้
ช่วยตอบ 3 คำถาม:
🔹 โซนราคาที่มี Volume สูงสุดย้ายขึ้นหรือลง?
🔹 Value Area สองช่วงทับซ้อนกันมากแค่ไหน?
🔹 ราคายืนเหนือ ยืนใต้ หรือกลับเข้ามาใน Value Area ล่าสุดแล้ว?
Indicator ใช้การประมาณจากข้อมูล OHLCV ของแท่งใน Timeframe กราฟ ไม่ได้ใช้ข้อมูล Volume รายธุรกรรม ข้อมูล Bid/Ask หรือ Order Flow
⏺️ Why use Volume Profile Context?
🔹 Compares two periods on the same price grid
🔹 Separates changes in volume distribution from price reactions to existing reference levels
🔹 Displays POC migration and Value Area overlap numerically
🔹 Keeps reaction levels fixed between profile updates
🔹 Provides closed-bar alerts with configurable confirmation
A rising POC describes an upward shift in the highest estimated-volume row. It does not, by itself, prove buying pressure or predict further gains.
⏺️ ทำไมต้องใช้?
🔹 เปรียบเทียบสองช่วงบนระดับราคาเดียวกัน
🔹 แยกการเปลี่ยนของโซน Volume ออกจากปฏิกิริยาราคาต่อระดับอ้างอิงเดิม
🔹 แสดงการย้ายของ POC และการทับซ้อนของ Value Area เป็นตัวเลข
🔹 ล็อกระดับสำหรับติดตามราคาจนถึงรอบอัปเดตถัดไป
🔹 มี Alert จากแท่งปิด โดยปรับจำนวนแท่งยืนยันได้
POC ที่ย้ายสูงขึ้นหมายถึงแถวราคาที่มี Volume โดยประมาณสูงสุดย้ายขึ้น ไม่ได้ยืนยันแรงซื้อหรือรับประกันว่าราคาจะขึ้นต่อ
⏺️ How does it work?
By default, the indicator compares:
🔹 Recent Window — the latest completed 100-bar block
🔹 Older Window — the preceding 100-bar block
🔹 Shared Grid — 36 price rows covering the combined high/low range
Both windows use identical price boundaries and histogram scaling.
Profiles refresh every 100 closed bars. After each refresh, the latest POC, VAH, and VAL remain fixed until the next refresh.
This is a completed-block comparison, not a continuously rolling or session-based profile.
⏺️ ทำงานอย่างไร?
ค่าเริ่มต้นเปรียบเทียบ:
🔹 Recent Window — ช่วงล่าสุดที่จบแล้ว 100 แท่ง
🔹 Older Window — ช่วงก่อนหน้าที่ติดกัน 100 แท่ง
🔹 Shared Grid — ระดับราคา 36 แถว ครอบคลุม High–Low ของทั้งสองช่วง
สองช่วงใช้ขอบระดับราคาและสเกล Histogram เดียวกัน
โปรไฟล์อัปเดตทุก 100 แท่งปิด จากนั้น POC, VAH และ VAL ล่าสุดจะคงที่จนถึงรอบถัดไป
จึงเป็นการเปรียบเทียบช่วงที่จบแล้ว ไม่ใช่โปรไฟล์ที่เลื่อนใหม่ทุกแท่งหรือแบ่งตาม Session โดยอัตโนมัติ
⏺️ Key measurements
🔹 POC1 — the center of the row with the highest estimated volume in the recent window
🔹 POC Migration — recent POC minus older POC, expressed in price units and row units
🔹 VAH / VAL — the upper and lower boundaries of the recent Value Area
🔹 Value Area Overlap — intersection width divided by union width of the two Value Areas
🔹 Node2 — a qualifying secondary local volume peak, not a second global POC
🔹 Valley Ratio — the smallest row volume between POC1 and Node2, divided by the weaker peak’s volume
🔹 POC Share — POC row volume divided by total recent-window volume
⏺️ ตัวเลขสำคัญ
🔹 POC1 — ราคากึ่งกลางของแถวที่มี Volume โดยประมาณสูงสุดในช่วงล่าสุด
🔹 POC Migration — POC ล่าสุดลบ POC ช่วงก่อนหน้า แสดงเป็นหน่วยราคาและจำนวนแถว
🔹 VAH / VAL — ขอบบนและขอบล่างของ Value Area ล่าสุด
🔹 Value Area Overlap — ความกว้างส่วนทับซ้อน หารด้วยความกว้างพื้นที่รวมของ Value Area ทั้งสองช่วง
🔹 Node2 — ยอด Volume รองที่ผ่านเกณฑ์ ไม่ใช่ POC หลักอีกตัว
🔹 Valley Ratio — Volume ต่ำสุดในแถวระหว่าง POC1 กับ Node2 เทียบกับ Volume ของยอดที่เล็กกว่า
🔹 POC Share — Volume ในแถว POC เทียบกับ Volume รวมของช่วงล่าสุด
⏺️ How to interpret the measurements
🔹 Positive POC Migration — the highest estimated-volume row moved upward
🔹 Negative POC Migration — it moved downward
🔹 High VA Overlap — the two Value Areas occupy similar price regions
🔹 Low VA Overlap — the two Value Areas occupy less overlapping price regions
🔹 Low Valley Ratio — a deeper estimated-volume gap exists between the two qualified peaks
For example, VA Overlap of 80% describes the overlap of two price intervals. It is not an 80% probability of support, resistance, or trade success.
Node2 is shown only when it meets the selected volume and separation requirements. Some profiles have no qualifying second node.
⏺️ ตีความอย่างไร?
🔹 POC Migration เป็นบวก — แถวที่มี Volume สูงสุดย้ายขึ้น
🔹 POC Migration เป็นลบ — แถวที่มี Volume สูงสุดย้ายลง
🔹 VA Overlap สูง — Value Area สองช่วงอยู่ในบริเวณราคาคล้ายกัน
🔹 VA Overlap ต่ำ — Value Area สองช่วงทับซ้อนกันน้อย
🔹 Valley Ratio ต่ำ — มีช่อง Volume โดยประมาณที่ลึกขึ้นระหว่างยอดทั้งสอง
ตัวอย่าง: VA Overlap 80% หมายถึงสัดส่วนการทับซ้อนของช่วงราคา ไม่ใช่โอกาสเป็นแนวรับ/แนวต้านหรือโอกาสชนะ 80%
Node2 จะแสดงเมื่อผ่านเกณฑ์ขนาด Volume และระยะห่างที่กำหนด บางโปรไฟล์จึงไม่มี Node2
⏺️ How to read the chart
🔹 Blue/orange filled histogram — recent-window up/down volume proxies
🔹 Gray histogram outlines — older-window total estimated volume
🔹 Red line — recent frozen POC1
🔹 Teal lines — recent frozen VAH and VAL
🔹 Gray reference line — older-window POC
🔹 Purple line — qualified Node2, when available
Rows inside the recent Value Area use stronger colors. Rows outside use lighter colors.
The up/down split is a candle-based approximation. It is not actual aggressive buying/selling volume.
⏺️ อ่านกราฟอย่างไร?
🔹 Histogram สีฟ้า/ส้ม — Volume ขึ้น/ลงโดยประมาณของช่วงล่าสุด
🔹 เส้นกรอบ Histogram สีเทา — Volume รวมโดยประมาณของช่วงก่อนหน้า
🔹 เส้นแดง — POC1 ล่าสุดที่ล็อกไว้
🔹 เส้นเขียวอมฟ้า — VAH และ VAL ล่าสุดที่ล็อกไว้
🔹 เส้นอ้างอิงเทา — POC ช่วงก่อนหน้า
🔹 เส้นม่วง — Node2 เมื่อพบจุดที่ผ่านเกณฑ์
แถวใน Value Area ล่าสุดแสดงสีเข้มกว่า ส่วนแถวนอกโซนแสดงสีอ่อนกว่า
การแยกขึ้น/ลงเป็นการประมาณจากแท่งราคา ไม่ใช่ Volume ของคำสั่งซื้อหรือขายเชิงรุกจริง
⏺️ Frozen Value Area reactions
After a profile refresh, the indicator monitors subsequent closes against the fixed VAH and VAL:
🔹 Above VA — consecutive closes above VAH
🔹 Below VA — consecutive closes below VAL
🔹 Returned Inside VA — consecutive closes inside, following a previously confirmed outside position
The default confirmation is 2 consecutive closed bars. A close exactly at VAH or VAL counts as inside.
The refresh bar creates the reference and is not counted as a reaction. Confirmation resets at every profile refresh.
These events describe price location; they are not automatic entry or exit instructions.
⏺️ การติดตามราคากับ Value Area ที่ล็อกไว้
หลังอัปเดตโปรไฟล์ ระบบติดตามราคาปิดของแท่งถัดไปเทียบกับ VAH/VAL ที่คงที่:
🔹 Above VA — ปิดเหนือ VAH ต่อเนื่องตามเกณฑ์
🔹 Below VA — ปิดใต้ VAL ต่อเนื่องตามเกณฑ์
🔹 Returned Inside VA — ปิดกลับเข้าโซน หลังเคยยืนยันสถานะนอกโซนแล้ว
ค่าเริ่มต้นรอ 2 แท่งปิดต่อเนื่อง ราคาปิดตรง VAH หรือ VAL ถือว่าอยู่ภายใน
แท่งอัปเดตใช้สร้างระดับอ้างอิง ไม่ได้นับเป็นปฏิกิริยา และการยืนยันจะเริ่มใหม่ทุกครั้งที่โปรไฟล์อัปเดต
เหตุการณ์เหล่านี้บอกตำแหน่งราคา ไม่ใช่คำสั่ง Entry / Exit โดยอัตโนมัติ
⏺️ Calculation methodology
Volume is distributed across price rows using overlap with each candle’s body and wicks.
🔹 Wick length receives twice the weighting of body length
🔹 Body volume is assigned by candle direction
🔹 Wick volume is split equally between up/down proxies
🔹 Flat candles place their volume in one row, split equally
The Value Area starts at POC and expands contiguously toward the adjacent row with greater volume until it contains at least the target percentage.
Full-row inclusion can exceed the target. Actual coverage is shown in the dashboard. Zero-volume gaps can be included during expansion.
This method can differ from TradingView’s built-in Volume Profile calculations.
⏺️ วิธีคำนวณ
กระจาย Volume ไปยังแต่ละแถวตามระยะทับซ้อนกับ Body และ Wick ของแท่งราคา
🔹 ความยาว Wick ได้รับน้ำหนักสองเท่าของความยาว Body
🔹 Volume ส่วน Body แบ่งตามทิศทางแท่ง
🔹 Volume ส่วน Wick แบ่งขึ้น/ลงเท่ากัน
🔹 แท่งแบนวาง Volume ในแถวราคาเดียวและแบ่งเท่ากัน
Value Area เริ่มจาก POC แล้วขยายต่อเนื่องไปยังแถวข้างเคียงที่มี Volume มากกว่า จนรวมได้อย่างน้อยเปอร์เซ็นต์เป้าหมาย
การรวมทั้งแถวอาจทำให้เกินเป้าหมาย จึงแสดงเปอร์เซ็นต์จริงใน Dashboard และอาจรวมแถวที่ไม่มี Volume เพื่อขยายผ่านช่องว่าง
วิธีนี้อาจให้ผลต่างจาก Volume Profile มาตรฐานของ TradingView
⏺️ Default settings and alignment
🔹 Bars per Window — 100
🔹 Price Rows — 36
🔹 Value Area Target — 70%
🔹 Node2 Minimum Volume — 60% of POC row volume
🔹 Node2 Minimum Separation — 4 rows
🔹 Reaction Confirmation — 2 closed bars
Two full windows are required before the first comparison.
By default, block counting starts at the first loaded chart bar. Loading more history can change block alignment. An explicit Block Anchor Time can provide more consistent alignment when that time remains within loaded history.
⏺️ ค่าเริ่มต้นและการแบ่งช่วง
🔹 Bars per Window — ช่วงละ 100 แท่ง
🔹 Price Rows — 36 แถว
🔹 Value Area Target — 70%
🔹 Node2 Minimum Volume — 60% ของ Volume แถว POC
🔹 Node2 Minimum Separation — ห่างอย่างน้อย 4 แถว
🔹 Reaction Confirmation — 2 แท่งปิด
ต้องมีข้อมูลครบสองช่วงก่อนแสดงการเปรียบเทียบครั้งแรก
ค่าเริ่มต้นนับช่วงจากแท่งแรกที่โหลด การโหลดประวัติเพิ่มอาจเปลี่ยนการแบ่งช่วง หากต้องการความสอดคล้องมากขึ้น ให้ตั้ง Block Anchor Time ที่ยังอยู่ในประวัติกราฟที่โหลด
⏺️ Alerts
🔹 Confirmed above frozen VA
🔹 Confirmed below frozen VA
🔹 Returned inside frozen VA
🔹 Any confirmed value-position change
Alerts occur on confirmed position changes rather than on every bar.
Create an alert in TradingView and select “Once Per Bar Close.” Recreate alerts after changing the indicator’s inputs or source code.
⏺️ การแจ้งเตือน
🔹 Confirmed above frozen VA — ยืนยันเหนือ Value Area
🔹 Confirmed below frozen VA — ยืนยันใต้ Value Area
🔹 Returned inside frozen VA — ยืนยันการกลับเข้า Value Area
🔹 Any confirmed value-position change — การเปลี่ยนตำแหน่งที่ยืนยันทุกประเภท
แจ้งเมื่อสถานะยืนยันเปลี่ยน ไม่ได้แจ้งทุกแท่ง
สร้าง Alert ใน TradingView และเลือก “Once Per Bar Close” หากเปลี่ยน Input หรือโค้ด ให้สร้าง Alert ใหม่
⏺️ Suitable applications
Use standard time-based candlestick charts with meaningful, sufficiently continuous volume data.
For TFEX evaluation, SET50 Index Futures and Gold Online Futures are suggested starting points. Choose the actively traded contract month and keep session settings consistent.
These are proposed testing applications, not claims of validated performance. Check how the data feed handles volume, missing bars, and contract changes.
⏺️ การประยุกต์ใช้งาน
ใช้กับกราฟแท่งเทียนตามเวลาที่มีข้อมูล Volume เหมาะสมและต่อเนื่องเพียงพอ
สำหรับการทดลองใน TFEX สามารถเริ่มจาก SET50 Index Futures และ Gold Online Futures โดยเลือกเดือนสัญญาที่มีการซื้อขายหนาแน่น และใช้การตั้งค่า Session ให้สอดคล้องกัน
เป็นข้อเสนอสำหรับทดลอง ไม่ใช่ผลยืนยันประสิทธิภาพ ควรตรวจการแสดง Volume แท่งที่ข้อมูลหาย และการเปลี่ยนสัญญาของฟีดที่ใช้
⏺️ Development and attribution
This version extends the user-supplied [DAOL] Volume Profile v5 baseline. Its body/wick allocation approach is retained in redesigned functions with safer handling of flat candles and zero-length segments.
The added workflow includes shared-grid window comparison, POC migration, Value Area overlap, secondary-node context, frozen reference levels, and closed-bar reaction alerts.
The supplied legacy header retains an MPL 2.0 notice but does not identify the original author. Exact upstream authorship has not been established.
Related public baseline precedent:
Volume Profile / Fixed Range by LonesomeTheBlue
Concept definitions and calculation context:
TradingView — Volume profile indicators: basic concepts
tradingview.com/support/solutions/43000502040-volume-profile-indicators-basic-concepts/
No claim is made that Volume Profile or all underlying concepts are new. References do not imply endorsement.
⏺️ การพัฒนาและอ้างอิง
เวอร์ชันนี้ต่อยอดจาก [DAOL] Volume Profile v5 ที่ผู้ใช้ส่งมา โดยคงแนวทางแบ่ง Volume ตาม Body/Wick และออกแบบฟังก์ชันใหม่ให้รองรับแท่งแบนกับส่วนราคาที่มีความยาวเป็นศูนย์
ส่วนที่เพิ่มคือการเปรียบเทียบสองช่วงบนกริดเดียวกัน การย้ายของ POC การทับซ้อนของ Value Area บริบทของยอดรอง ระดับอ้างอิงที่ล็อกไว้ และ Alert จากราคาปิด
ส่วนหัวโค้ดฐานมีประกาศ MPL 2.0 แต่ไม่ระบุชื่อผู้เขียน จึงยังยืนยันผู้เขียนต้นฉบับไม่ได้ แหล่งอ้างอิงด้านบนระบุแนวคิดและงานพื้นฐานที่เกี่ยวข้อง ไม่ได้หมายถึงการรับรองจากผู้เขียนเหล่านั้น
⏺️ Limitations and disclaimer
🔹 Estimated chart-bar volume distribution is not exact transaction-level volume-at-price.
🔹 Up/down proxies do not identify actual buyers, sellers, or “smart money.”
🔹 Results depend on row count, timeframe, block alignment, and the volume feed.
🔹 Missing volume or zero-total-volume windows disable context and alerts for that snapshot.
🔹 Frozen levels can become stale between updates; snapshot age is displayed.
🔹 The histogram shows only the latest completed snapshot. It is not a historical developing-profile reconstruction.
🔹 Numerical checks have been completed, but TradingView compilation, runtime performance, and real-market validation remain pending for this version.
🔹 For educational and informational purposes only. It does not constitute investment advice or guarantee trading results.
⏺️ ข้อจำกัดและคำชี้แจง
🔹 เป็นการประมาณ Volume จากแท่งกราฟ ไม่ใช่ Volume รายราคาจากธุรกรรมจริง
🔹 สีขึ้น/ลงไม่ได้ระบุผู้ซื้อ ผู้ขาย หรือ Smart Money
🔹 จำนวนแถว Timeframe การแบ่งช่วง และแหล่งข้อมูล Volume มีผลต่อผลลัพธ์
🔹 หาก Volume ขาดหายหรือช่วงใดมี Volume รวมเป็นศูนย์ จะปิดบริบทและ Alert ของ Snapshot นั้น
🔹 ระดับที่ล็อกไว้อาจล้าสมัยระหว่างรอบ จึงแสดงอายุ Snapshot
🔹 Histogram แสดง Snapshot ล่าสุดที่จบแล้ว ไม่ใช่การสร้างโปรไฟล์ระหว่างทางย้อนหลัง
🔹 ตรวจสูตรเชิงตัวเลขแล้ว แต่ยังรอการ Compile ตรวจความเร็วบน TradingView และทดสอบกับตลาดจริง
🔹 ใช้เพื่อการศึกษาและประกอบการวิเคราะห์ ไม่ถือเป็นคำแนะนำการลงทุนหรือการรับประกันผลลัพธ์

Отказ от ответственности
Информация и публикации не предназначены для предоставления и не являются финансовыми, инвестиционными, торговыми или другими видами советов или рекомендаций, предоставленных или одобренных TradingView. Подробнее читайте в Условиях использования.
Отказ от ответственности
Информация и публикации не предназначены для предоставления и не являются финансовыми, инвестиционными, торговыми или другими видами советов или рекомендаций, предоставленных или одобренных TradingView. Подробнее читайте в Условиях использования.