Liquidity Voids [Quantum Edge]
Liquidity Voids [Quantum Edge]
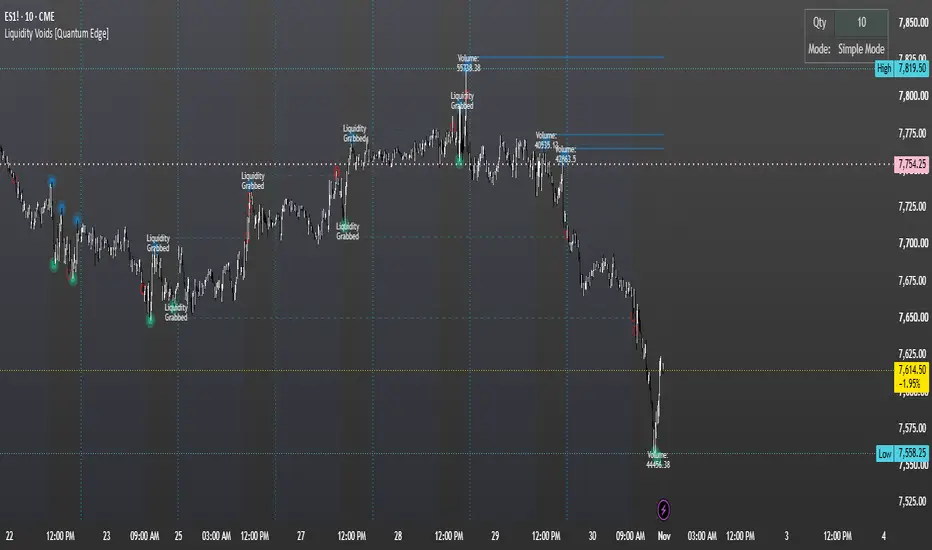
Liquidity Voids [Quantum Edge] is a pivot-based overlay that highlights volume-filtered swing points and projects volatility-adjusted zones beyond their highs and lows. It combines pivot markers, colored zones, extending reference lines, and visual tracking of price crossing those projected levels.
Despite its name, this indicator does not measure actual liquidity voids, order-book gaps, or resting orders. Its zones are calculated from price pivots, chart volume, and Average True Range—not from direct liquidity data.
How pivots are identified
The Length setting determines the pivot-detection window:
Left-side bars: Length.
Right-side bars: Length minus 2.
With the default Length of 10, a pivot requires 10 bars to its left and 8 bars to its right.
Once a qualifying pivot is detected, its marker and zone are drawn back at the original pivot candle. This means the historical placement appears earlier than the time the pivot became detectable.
Volume strength filter
Pivots must pass a volume-strength filter before a zone is created.
The indicator calculates:
A simple moving average of volume over the right-side pivot length.
The 500-period standard deviation of that averaged-volume series.
A strength score equal to averaged volume divided by that standard deviation.
The score associated with the pivot candle must exceed the selected threshold:
Filter Required strength score
Low Greater than 1
Mid Greater than 2
High Greater than 3
This score is not a conventional z-score, because the calculation does not subtract the mean. It is also not a multiple of average volume.
Zone color intensity increases with the calculated strength score. The volume printed inside each zone is the averaged-volume value associated with the pivot candle—not the total volume traded within the zone.
Upper and lower zones
For qualifying pivot highs, the indicator draws an upper zone extending from the pivot high to a projected level above it.
For qualifying pivot lows, it draws a lower zone extending from the pivot low to a projected level below it.
Each zone includes:
A colored box spanning eight bars horizontally from the pivot candle.
A volume label.
A horizontal reference line at the zone’s outer projected boundary.
The box remains at its original horizontal span. The outer reference line extends forward while it remains active.
Simple and dynamic distance modes
Simple Mode
Uses ATR(200) from the bar on which the pivot is detected as the distance beyond the pivot.
Dynamic Mode
Uses the pivot candle’s volume-strength score and ATR:
Distance
=
Pivot volume-strength score
×
Pivot ATR(200)
2
Distance=
2
Pivot volume-strength score×Pivot ATR(200)
Dynamic Mode therefore adjusts zone depth using both the calculated volume strength and volatility.
“Liquidity Grabbed” tracking
A projected level is marked as “Liquidity Grabbed” when a candle’s range strictly crosses the outer reference line:
High
>
Reference level
and
Low
<
Reference level
High>Reference levelandLow<Reference level
When this occurs:
The reference line becomes thin and dashed.
Its forward extension stops.
The zone’s background is removed.
The box text changes to “Liquidity Grabbed.”
A red circular marker appears at the crossed level.
This condition tracks a price-range crossing only. It does not require a rejection, reclaim, candle-close confirmation, or reversal.
An exact touch does not satisfy the strict crossing condition. A gap entirely beyond the level also does not satisfy it unless a candle’s range spans the level.
Settings
Length
Controls pivot sensitivity and confirmation delay. The default is 10. Use a value of at least 3 so the derived right-side length remains positive.
Zones Amount
Sets the retained drawing limit for zones and reference lines, from 1 to 50. The default is 10.
Volume Strength Filter
Selects Low, Mid, or High filtering thresholds.
Dynamic Distance
Switches between simple ATR distance and volume-strength-adjusted distance.
Filtered Pivots
Shows or hides circular markers at qualifying pivot highs and lows.
Upper / Lower Colors
Customizes the upper and lower zone colors.
Dashboard
A compact dashboard displays:
Qty: the configured Zones Amount, not a live count of untouched zones.
Mode: whether Simple Mode or Dynamic Mode is selected.
How to interpret the indicator
Use the zones as calculated reference areas around volume-filtered pivots. They can help organize a review of how price approaches and crosses projected levels beyond prior swing points.
A marked crossing is not, by itself, confirmation of a liquidity sweep or a complete trading setup. The script does not require displacement, a retest, SMT, or an engulfing or rejection confirmation.
Important limitations
Pivot drawings are backdated to the pivot candle after the right-side detection delay. They were not available at that earlier candle in realtime.
Pivot creation and level-crossing logic are not explicitly restricted to confirmed candle closes. Current-bar conditions can change before the bar closes.
Extension and crossing updates are restricted to the most recent 1,500 bars relative to the chart’s last bar.
The volume-strength calculation requires sufficient history for its 500-period standard-deviation window and valid volume data.
The indicator does not detect fair value gaps, measure low-volume areas within the projected zones, or verify actual liquidity availability.
It does not classify internal versus external liquidity or confirm a reversal after a level is crossed.
No dedicated alerts, strategy orders, position sizing, or backtest statistics are included.
For educational and analytical use only. Projected zones and “Liquidity Grabbed” labels do not guarantee actual liquidity removal, future price direction, or profitable trading outcomes.
Liquidity Voids [Quantum Edge] is a pivot-based overlay that highlights volume-filtered swing points and projects volatility-adjusted zones beyond their highs and lows. It combines pivot markers, colored zones, extending reference lines, and visual tracking of price crossing those projected levels.
Despite its name, this indicator does not measure actual liquidity voids, order-book gaps, or resting orders. Its zones are calculated from price pivots, chart volume, and Average True Range—not from direct liquidity data.
How pivots are identified
The Length setting determines the pivot-detection window:
Left-side bars: Length.
Right-side bars: Length minus 2.
With the default Length of 10, a pivot requires 10 bars to its left and 8 bars to its right.
Once a qualifying pivot is detected, its marker and zone are drawn back at the original pivot candle. This means the historical placement appears earlier than the time the pivot became detectable.
Volume strength filter
Pivots must pass a volume-strength filter before a zone is created.
The indicator calculates:
A simple moving average of volume over the right-side pivot length.
The 500-period standard deviation of that averaged-volume series.
A strength score equal to averaged volume divided by that standard deviation.
The score associated with the pivot candle must exceed the selected threshold:
Filter Required strength score
Low Greater than 1
Mid Greater than 2
High Greater than 3
This score is not a conventional z-score, because the calculation does not subtract the mean. It is also not a multiple of average volume.
Zone color intensity increases with the calculated strength score. The volume printed inside each zone is the averaged-volume value associated with the pivot candle—not the total volume traded within the zone.
Upper and lower zones
For qualifying pivot highs, the indicator draws an upper zone extending from the pivot high to a projected level above it.
For qualifying pivot lows, it draws a lower zone extending from the pivot low to a projected level below it.
Each zone includes:
A colored box spanning eight bars horizontally from the pivot candle.
A volume label.
A horizontal reference line at the zone’s outer projected boundary.
The box remains at its original horizontal span. The outer reference line extends forward while it remains active.
Simple and dynamic distance modes
Simple Mode
Uses ATR(200) from the bar on which the pivot is detected as the distance beyond the pivot.
Dynamic Mode
Uses the pivot candle’s volume-strength score and ATR:
Distance
=
Pivot volume-strength score
×
Pivot ATR(200)
2
Distance=
2
Pivot volume-strength score×Pivot ATR(200)
Dynamic Mode therefore adjusts zone depth using both the calculated volume strength and volatility.
“Liquidity Grabbed” tracking
A projected level is marked as “Liquidity Grabbed” when a candle’s range strictly crosses the outer reference line:
High
>
Reference level
and
Low
<
Reference level
High>Reference levelandLow<Reference level
When this occurs:
The reference line becomes thin and dashed.
Its forward extension stops.
The zone’s background is removed.
The box text changes to “Liquidity Grabbed.”
A red circular marker appears at the crossed level.
This condition tracks a price-range crossing only. It does not require a rejection, reclaim, candle-close confirmation, or reversal.
An exact touch does not satisfy the strict crossing condition. A gap entirely beyond the level also does not satisfy it unless a candle’s range spans the level.
Settings
Length
Controls pivot sensitivity and confirmation delay. The default is 10. Use a value of at least 3 so the derived right-side length remains positive.
Zones Amount
Sets the retained drawing limit for zones and reference lines, from 1 to 50. The default is 10.
Volume Strength Filter
Selects Low, Mid, or High filtering thresholds.
Dynamic Distance
Switches between simple ATR distance and volume-strength-adjusted distance.
Filtered Pivots
Shows or hides circular markers at qualifying pivot highs and lows.
Upper / Lower Colors
Customizes the upper and lower zone colors.
Dashboard
A compact dashboard displays:
Qty: the configured Zones Amount, not a live count of untouched zones.
Mode: whether Simple Mode or Dynamic Mode is selected.
How to interpret the indicator
Use the zones as calculated reference areas around volume-filtered pivots. They can help organize a review of how price approaches and crosses projected levels beyond prior swing points.
A marked crossing is not, by itself, confirmation of a liquidity sweep or a complete trading setup. The script does not require displacement, a retest, SMT, or an engulfing or rejection confirmation.
Important limitations
Pivot drawings are backdated to the pivot candle after the right-side detection delay. They were not available at that earlier candle in realtime.
Pivot creation and level-crossing logic are not explicitly restricted to confirmed candle closes. Current-bar conditions can change before the bar closes.
Extension and crossing updates are restricted to the most recent 1,500 bars relative to the chart’s last bar.
The volume-strength calculation requires sufficient history for its 500-period standard-deviation window and valid volume data.
The indicator does not detect fair value gaps, measure low-volume areas within the projected zones, or verify actual liquidity availability.
It does not classify internal versus external liquidity or confirm a reversal after a level is crossed.
No dedicated alerts, strategy orders, position sizing, or backtest statistics are included.
For educational and analytical use only. Projected zones and “Liquidity Grabbed” labels do not guarantee actual liquidity removal, future price direction, or profitable trading outcomes.

Отказ от ответственности
Информация и публикации не предназначены для предоставления и не являются финансовыми, инвестиционными, торговыми или другими видами советов или рекомендаций, предоставленных или одобренных TradingView. Подробнее читайте в Условиях использования.
Отказ от ответственности
Информация и публикации не предназначены для предоставления и не являются финансовыми, инвестиционными, торговыми или другими видами советов или рекомендаций, предоставленных или одобренных TradingView. Подробнее читайте в Условиях использования.