OPEN-SOURCE SCRIPT
Temporal Flow Analyzer [JOAT]
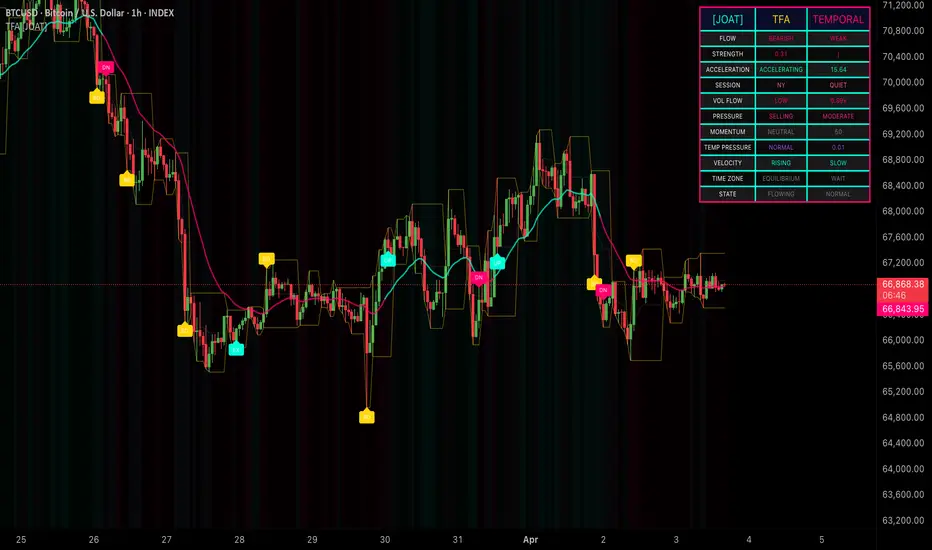
Temporal Flow Analyzer [JOAT]
Introduction
The Temporal Flow Analyzer is an advanced open-source time-based analysis indicator that examines price flow across temporal dimensions, session dynamics, and time-weighted patterns to identify institutional activity timing and flow shifts. This indicator transforms time-based market data into actionable flow intelligence, helping traders identify when price flow is accelerating, decelerating, reversing, or experiencing temporal pressure changes.
Unlike basic trend indicators that ignore time dynamics, this system analyzes flow direction, flow strength, flow acceleration, session-based patterns, temporal pressure, and time zone positioning. The indicator is designed for traders who understand that institutional activity follows temporal patterns and that time-based analysis reveals flow dynamics invisible to price-only indicators.
Why This Indicator Exists
This indicator addresses a fundamental aspect of market analysis often overlooked: the temporal dimension of price flow. Markets don't just move in price - they move through time, and the relationship between price movement and time reveals institutional flow dynamics. The core innovation lies in analyzing multiple temporal dimensions:
Each component reveals different aspects of temporal flow. Price flow shows direction, session analysis provides timing context, momentum shows strength, volume flow confirms participation, time zones show value, flow shifts warn of reversals, exhaustion signals caution, and temporal pressure quantifies intensity.

Core Components Explained
1. Price Flow Calculation
Price flow measures directional movement using dual exponential moving averages:
Price Flow = EMA(Close, Flow Period) - EMA(Close, Flow Period * 2)
This calculation creates a zero-centered oscillator:
- Positive values indicate bullish flow (faster EMA above slower EMA)
- Negative values indicate bearish flow (faster EMA below slower EMA)
- Magnitude shows flow strength
Flow Direction = Price Flow > 0 ? Bullish : Bearish
Flow Strength = Absolute(Price Flow) / ATR(14)
Flow strength normalization using ATR ensures cross-instrument comparison and removes price-level bias. Values above 1.5 indicate strong flow, 0.8-1.5 moderate flow, below 0.8 weak flow.
Flow Acceleration = Change in Price Flow over 3 bars
Positive acceleration indicates flow is building, negative acceleration indicates flow is fading. This provides early warning of flow changes before they become obvious in the main flow metric.
2. Session Detection and Analysis
The indicator identifies three major trading sessions using UTC hour detection:
Asian Session: Customizable start hour (default 0 UTC) to London start
London Session: Customizable start hour (default 7 UTC) to NY start
NY Session: Customizable start hour (default 12 UTC) to Asian start
Session tracking maintains:
- Session High: Highest price since session start
- Session Low: Lowest price since session start
- Session Start Bar: Bar index when session began
- New Session Flag: Triggers on session transitions
Session boxes are drawn showing the high/low range for each session, providing visual context for session-based support/resistance and breakout analysis.
3. Session Breakout Detection
Session breakouts mark when price exceeds previous session boundaries with conviction:
Session Breakout Up:
- High > Previous Session High
- Volume > Average Volume * 2.0
- Close > Previous Session High (confirms breakout, not just wick)
Session Breakout Down:
- Low < Previous Session Low
- Volume > Average Volume * 2.0
- Close < Previous Session Low
These breakouts often mark the start of significant moves as price breaks out of established ranges with institutional participation (confirmed by volume). The indicator places small labels marking breakout events.
4. Temporal Momentum Analysis
Temporal momentum combines RSI with flow-based weighting:
Momentum = RSI(Close, Momentum Length) [default 14]
Momentum Flow = EMA(Momentum, 5)
Momentum Divergence = Momentum - Momentum Flow
Momentum Acceleration = Change in Momentum over 3 bars
Momentum classification:
- Overbought: Momentum > 70
- Oversold: Momentum < 30
- Neutral: Momentum between 30 and 70
The indicator tracks momentum divergence to identify when momentum is deviating from its trend, often preceding flow reversals.
5. Volume Flow Dynamics
Volume flow analysis separates buying and selling pressure:
Volume Flow = EMA(Volume, Volume Flow Period) [default 10]
Volume Flow Delta = Current Volume - Volume Flow
Volume Flow Ratio = Current Volume / Volume Flow
Buying Pressure = Volume when Close > Open
Selling Pressure = Volume when Close < Open
Net Pressure = EMA(Buying Pressure - Selling Pressure, Volume Flow Period)
Net pressure reveals institutional positioning:
- Positive net pressure: Institutions accumulating (buying dominance)
- Negative net pressure: Institutions distributing (selling dominance)
- Magnitude shows intensity of positioning
6. Time Zone Position Analysis
The indicator calculates price position within the session range:
Session Range = Session High - Session Low
Session Mid = (Session High + Session Low) / 2
Premium Zone = Price > Session Mid + Range * 0.25 (upper 25%)
Discount Zone = Price < Session Mid - Range * 0.25 (lower 25%)
Equilibrium = Price between premium and discount zones
Smart money concepts suggest:
- Premium zones: Favorable for selling/distribution
- Discount zones: Favorable for buying/accumulation
- Equilibrium: No clear value edge
The dashboard displays current zone and suggested bias (SELL in premium, BUY in discount, WAIT in equilibrium).
7. Flow Shift Detection System
Flow shifts mark critical transitions in directional flow:
Flow Shift = Flow Direction changes from previous bar's direction
The indicator tracks the last flow direction and compares it to current direction. When they differ, a flow shift is detected. These shifts often mark:
- Trend reversals (shift from strong flow to opposite flow)
- Consolidation starts (shift from strong flow to weak flow)
- Breakout beginnings (shift from weak flow to strong flow)
Flow shift labels are placed at shift points with direction indicators (UP for bullish shift, DN for bearish shift).
8. Accumulation and Distribution Detection
The indicator identifies institutional accumulation/distribution using strict criteria:
Strong Accumulation:
- Close > Open (bullish candle)
- Volume > Average Volume * 2.5 (very high participation)
- Close > EMA(20) (above trend)
- Close > High[1] (breaking above previous high)
- Momentum < 50 (not overbought)
Strong Distribution:
- Close < Open (bearish candle)
- Volume > Average Volume * 2.5
- Close < EMA(20) (below trend)
- Close < Low[1] (breaking below previous low)
- Momentum > 50 (not oversold)
These strict criteria ensure only genuine institutional positioning is flagged, not retail noise. Labels mark accumulation ("A") and distribution ("D") events.
9. Flow Divergence Analysis
Flow divergences identify price-flow asymmetries:
Bullish Flow Divergence:
- Price makes lower low (Price < Price[10])
- Flow makes higher low (Flow > Flow[10])
- Momentum < 35 (oversold context)
- Flow Strength > 0.5 (significant flow)
Bearish Flow Divergence:
- Price makes higher high (Price > Price[10])
- Flow makes lower high (Flow < Flow[10])
- Momentum > 65 (overbought context)
- Flow Strength > 0.5
Divergences warn that flow is not confirming price extremes, often preceding reversals. The indicator places "DIV" labels at divergence points.
10. Flow Exhaustion Detection
Flow exhaustion occurs when flow strength is high but acceleration is low:
Flow Exhaustion = Flow Strength > 2.0 AND Absolute(Momentum Acceleration) < 0.5
This condition suggests flow has reached extreme levels but is no longer accelerating, often marking climax moves before reversals. Exhaustion labels ("EX") warn traders to prepare for potential flow reversal.
11. Temporal Pressure Calculation
Temporal pressure combines multiple flow dimensions:
Temporal Pressure = (Price Flow / ATR) * (Volume Flow Ratio - 1) * Flow Strength
This calculation creates a comprehensive pressure metric:
- Positive values: Bullish temporal pressure
- Negative values: Bearish temporal pressure
- Magnitude shows pressure intensity
Extreme pressure (absolute value > 2.0) often precedes significant moves or reversals depending on context.
12. Flow Velocity Analysis
Flow velocity measures the rate of price change over time:
Flow Velocity = Change in Close over 5 bars / 5
Flow Velocity EMA = EMA(Flow Velocity, 10)
Velocity Divergence = Flow Velocity - Flow Velocity EMA
Velocity Threshold = ATR * 0.2
Velocity classification:
- Fast: Absolute Velocity > Velocity Threshold
- Slow: Absolute Velocity <= Velocity Threshold
Fast velocity indicates rapid flow, slow velocity indicates gradual flow. Velocity divergence shows when current velocity differs from average velocity.
Visual Elements
The visual system is designed for clarity with minimal clutter - only significant events are marked, and backgrounds are very subtle to avoid distraction.

Input Parameters
Temporal Settings:
Features:
Sessions:
Colors:
All colors are fully customizable including time bull (neon cyan), time bear (neon pink), session active (gold), flow positive (neon green), flow negative (pink), momentum high (purple), accumulation (cyan), and distribution (pink).
How to Use This Indicator
Step 1: Identify Flow Direction
Check dashboard "FLOW" field showing BULLISH or BEARISH. This indicates current directional flow. Note the status (STRONG/MODERATE/WEAK) showing flow strength.
Step 2: Monitor Flow Strength
Review "STRENGTH" metric showing flow intensity. Values above 1.5 indicate strong directional flow suitable for trend-following. Values below 0.8 suggest weak flow where range-bound strategies may work better.
Step 3: Watch Flow Acceleration
Check "ACCELERATION" showing ACCELERATING, DECELERATING, or STABLE. Accelerating flow confirms trend strength. Decelerating flow warns of potential exhaustion even if flow remains positive/negative.
Step 4: Identify Active Session
Review "SESSION" field showing ASIAN, LONDON, or NY. Different sessions have different characteristics - London and NY overlap often shows highest volatility and volume.
Step 5: Assess Volume Flow
Check "VOL FLOW" showing HIGH, NORMAL, or LOW. High volume flow confirms genuine institutional participation. Low volume flow suggests retail-dominated or thin-market conditions.
Step 6: Monitor Net Pressure
Review "PRESSURE" showing BUYING or SELLING with intensity (STRONG/MODERATE/WEAK). This reveals institutional positioning - sustained buying pressure suggests accumulation, sustained selling suggests distribution.
Step 7: Check Time Zone Position
Review "TIME ZONE" showing PREMIUM, DISCOUNT, or EQUILIBRIUM with bias suggestion. Buy in discount zones, sell in premium zones for optimal risk/reward aligned with smart money concepts.
Step 8: Watch for Flow Shifts
Flow shift labels mark critical transitions. These often provide early warning of trend changes before they're obvious in price. Shifts from strong flow to opposite flow are most significant.
Step 9: Use Divergence Warnings
Flow divergence labels warn when flow is not confirming price extremes. These often precede reversals and provide high-probability counter-trend entry opportunities.
Step 10: Monitor Flow State
Check "STATE" field showing current flow condition (EXHAUSTED, SHIFTING, BULL DIV, BEAR DIV, ACCUM, DISTRIB, or FLOWING). This provides immediate context for current flow dynamics.
Best Practices
Indicator Limitations
Technical Implementation
Built with Pine Script v6 using:
The code is fully open-source with detailed comments explaining temporal flow concepts.
Originality Statement
This indicator is original in its comprehensive temporal flow analysis approach. While individual components (flow, sessions, momentum, volume) are established concepts, this indicator is justified because:
Each component reveals different temporal dynamics: flow shows direction, sessions provide timing, momentum shows strength, volume confirms participation, time zones show value, shifts warn of changes, divergences signal reversals, exhaustion marks climaxes, and pressure quantifies intensity. The indicator's value lies in combining these complementary perspectives into a cohesive temporal flow analysis system.
Disclaimer
This indicator is provided for educational and informational purposes only. It is not financial advice or a recommendation to buy or sell any financial instrument. Trading involves substantial risk of loss and is not suitable for all investors.
Temporal flow analysis is a tool for understanding time-based market dynamics, not a crystal ball for predicting future price movement. Flow shifts do not guarantee trend changes. Session breakouts do not guarantee continuation. Past flow patterns do not guarantee future flow patterns. Market conditions change, and strategies that worked historically may not work in the future.
The metrics displayed are mathematical calculations based on current market data, not predictions of future price movement. Flow shifts, divergences, exhaustion signals, and session breakouts do not guarantee profitable trades. Users must conduct their own analysis and risk assessment before making trading decisions.
Always use proper risk management, including stop losses and position sizing appropriate for your account size and risk tolerance. Never risk more than you can afford to lose. Consider consulting with a qualified financial advisor before making investment decisions.
The author is not responsible for any losses incurred from using this indicator. Users assume full responsibility for all trading decisions made using this tool.
-Made with passion by officialjackofalltrades
Introduction
The Temporal Flow Analyzer is an advanced open-source time-based analysis indicator that examines price flow across temporal dimensions, session dynamics, and time-weighted patterns to identify institutional activity timing and flow shifts. This indicator transforms time-based market data into actionable flow intelligence, helping traders identify when price flow is accelerating, decelerating, reversing, or experiencing temporal pressure changes.
Unlike basic trend indicators that ignore time dynamics, this system analyzes flow direction, flow strength, flow acceleration, session-based patterns, temporal pressure, and time zone positioning. The indicator is designed for traders who understand that institutional activity follows temporal patterns and that time-based analysis reveals flow dynamics invisible to price-only indicators.
Why This Indicator Exists
This indicator addresses a fundamental aspect of market analysis often overlooked: the temporal dimension of price flow. Markets don't just move in price - they move through time, and the relationship between price movement and time reveals institutional flow dynamics. The core innovation lies in analyzing multiple temporal dimensions:
- Price Flow Analysis: Measures directional flow using dual-EMA comparison with strength and acceleration tracking
- Session Analysis: Identifies Asian, London, and NY sessions with session high/low tracking and breakout detection
- Temporal Momentum: RSI-based momentum with flow-weighted calculations and divergence detection
- Volume Flow: Analyzes volume flow patterns, net pressure, and buying/selling flow dynamics
- Time Zone Positioning: Determines if price is in premium, discount, or equilibrium zones within session range
- Flow Shift Detection: Identifies when flow direction changes, signaling potential trend reversals
- Flow Exhaustion: Detects when flow strength is high but acceleration is low, warning of exhaustion
- Temporal Pressure: Combines price flow, volume flow, and flow strength into unified pressure metric
Each component reveals different aspects of temporal flow. Price flow shows direction, session analysis provides timing context, momentum shows strength, volume flow confirms participation, time zones show value, flow shifts warn of reversals, exhaustion signals caution, and temporal pressure quantifies intensity.
Core Components Explained
1. Price Flow Calculation
Price flow measures directional movement using dual exponential moving averages:
Price Flow = EMA(Close, Flow Period) - EMA(Close, Flow Period * 2)
This calculation creates a zero-centered oscillator:
- Positive values indicate bullish flow (faster EMA above slower EMA)
- Negative values indicate bearish flow (faster EMA below slower EMA)
- Magnitude shows flow strength
Flow Direction = Price Flow > 0 ? Bullish : Bearish
Flow Strength = Absolute(Price Flow) / ATR(14)
Flow strength normalization using ATR ensures cross-instrument comparison and removes price-level bias. Values above 1.5 indicate strong flow, 0.8-1.5 moderate flow, below 0.8 weak flow.
Flow Acceleration = Change in Price Flow over 3 bars
Positive acceleration indicates flow is building, negative acceleration indicates flow is fading. This provides early warning of flow changes before they become obvious in the main flow metric.
2. Session Detection and Analysis
The indicator identifies three major trading sessions using UTC hour detection:
Asian Session: Customizable start hour (default 0 UTC) to London start
London Session: Customizable start hour (default 7 UTC) to NY start
NY Session: Customizable start hour (default 12 UTC) to Asian start
Session tracking maintains:
- Session High: Highest price since session start
- Session Low: Lowest price since session start
- Session Start Bar: Bar index when session began
- New Session Flag: Triggers on session transitions
Session boxes are drawn showing the high/low range for each session, providing visual context for session-based support/resistance and breakout analysis.
3. Session Breakout Detection
Session breakouts mark when price exceeds previous session boundaries with conviction:
Session Breakout Up:
- High > Previous Session High
- Volume > Average Volume * 2.0
- Close > Previous Session High (confirms breakout, not just wick)
Session Breakout Down:
- Low < Previous Session Low
- Volume > Average Volume * 2.0
- Close < Previous Session Low
These breakouts often mark the start of significant moves as price breaks out of established ranges with institutional participation (confirmed by volume). The indicator places small labels marking breakout events.
4. Temporal Momentum Analysis
Temporal momentum combines RSI with flow-based weighting:
Momentum = RSI(Close, Momentum Length) [default 14]
Momentum Flow = EMA(Momentum, 5)
Momentum Divergence = Momentum - Momentum Flow
Momentum Acceleration = Change in Momentum over 3 bars
Momentum classification:
- Overbought: Momentum > 70
- Oversold: Momentum < 30
- Neutral: Momentum between 30 and 70
The indicator tracks momentum divergence to identify when momentum is deviating from its trend, often preceding flow reversals.
5. Volume Flow Dynamics
Volume flow analysis separates buying and selling pressure:
Volume Flow = EMA(Volume, Volume Flow Period) [default 10]
Volume Flow Delta = Current Volume - Volume Flow
Volume Flow Ratio = Current Volume / Volume Flow
Buying Pressure = Volume when Close > Open
Selling Pressure = Volume when Close < Open
Net Pressure = EMA(Buying Pressure - Selling Pressure, Volume Flow Period)
Net pressure reveals institutional positioning:
- Positive net pressure: Institutions accumulating (buying dominance)
- Negative net pressure: Institutions distributing (selling dominance)
- Magnitude shows intensity of positioning
6. Time Zone Position Analysis
The indicator calculates price position within the session range:
Session Range = Session High - Session Low
Session Mid = (Session High + Session Low) / 2
Premium Zone = Price > Session Mid + Range * 0.25 (upper 25%)
Discount Zone = Price < Session Mid - Range * 0.25 (lower 25%)
Equilibrium = Price between premium and discount zones
Smart money concepts suggest:
- Premium zones: Favorable for selling/distribution
- Discount zones: Favorable for buying/accumulation
- Equilibrium: No clear value edge
The dashboard displays current zone and suggested bias (SELL in premium, BUY in discount, WAIT in equilibrium).
7. Flow Shift Detection System
Flow shifts mark critical transitions in directional flow:
Flow Shift = Flow Direction changes from previous bar's direction
The indicator tracks the last flow direction and compares it to current direction. When they differ, a flow shift is detected. These shifts often mark:
- Trend reversals (shift from strong flow to opposite flow)
- Consolidation starts (shift from strong flow to weak flow)
- Breakout beginnings (shift from weak flow to strong flow)
Flow shift labels are placed at shift points with direction indicators (UP for bullish shift, DN for bearish shift).
8. Accumulation and Distribution Detection
The indicator identifies institutional accumulation/distribution using strict criteria:
Strong Accumulation:
- Close > Open (bullish candle)
- Volume > Average Volume * 2.5 (very high participation)
- Close > EMA(20) (above trend)
- Close > High[1] (breaking above previous high)
- Momentum < 50 (not overbought)
Strong Distribution:
- Close < Open (bearish candle)
- Volume > Average Volume * 2.5
- Close < EMA(20) (below trend)
- Close < Low[1] (breaking below previous low)
- Momentum > 50 (not oversold)
These strict criteria ensure only genuine institutional positioning is flagged, not retail noise. Labels mark accumulation ("A") and distribution ("D") events.
9. Flow Divergence Analysis
Flow divergences identify price-flow asymmetries:
Bullish Flow Divergence:
- Price makes lower low (Price < Price[10])
- Flow makes higher low (Flow > Flow[10])
- Momentum < 35 (oversold context)
- Flow Strength > 0.5 (significant flow)
Bearish Flow Divergence:
- Price makes higher high (Price > Price[10])
- Flow makes lower high (Flow < Flow[10])
- Momentum > 65 (overbought context)
- Flow Strength > 0.5
Divergences warn that flow is not confirming price extremes, often preceding reversals. The indicator places "DIV" labels at divergence points.
10. Flow Exhaustion Detection
Flow exhaustion occurs when flow strength is high but acceleration is low:
Flow Exhaustion = Flow Strength > 2.0 AND Absolute(Momentum Acceleration) < 0.5
This condition suggests flow has reached extreme levels but is no longer accelerating, often marking climax moves before reversals. Exhaustion labels ("EX") warn traders to prepare for potential flow reversal.
11. Temporal Pressure Calculation
Temporal pressure combines multiple flow dimensions:
Temporal Pressure = (Price Flow / ATR) * (Volume Flow Ratio - 1) * Flow Strength
This calculation creates a comprehensive pressure metric:
- Positive values: Bullish temporal pressure
- Negative values: Bearish temporal pressure
- Magnitude shows pressure intensity
Extreme pressure (absolute value > 2.0) often precedes significant moves or reversals depending on context.
12. Flow Velocity Analysis
Flow velocity measures the rate of price change over time:
Flow Velocity = Change in Close over 5 bars / 5
Flow Velocity EMA = EMA(Flow Velocity, 10)
Velocity Divergence = Flow Velocity - Flow Velocity EMA
Velocity Threshold = ATR * 0.2
Velocity classification:
- Fast: Absolute Velocity > Velocity Threshold
- Slow: Absolute Velocity <= Velocity Threshold
Fast velocity indicates rapid flow, slow velocity indicates gradual flow. Velocity divergence shows when current velocity differs from average velocity.
Visual Elements
- Session Boxes: Colored boxes showing Asian (yellow), London (green), and NY (red) session ranges
- Flow Shift Labels: Small labels marking flow direction changes (UP/DN)
- Accumulation/Distribution Labels: Tiny labels marking institutional positioning (A/D)
- Flow Divergence Labels: Labels marking price-flow asymmetries (DIV)
- Session Breakout Labels: Labels marking session high/low breakouts (BO/BD)
- Flow Exhaustion Labels: Labels warning of flow exhaustion (EX)
- Time Zone Backgrounds: Subtle backgrounds showing premium (bearish) and discount (bullish) zones
- Flow Direction Background: Very subtle background showing current flow direction
- Session Level Lines: Dashed lines showing session high, mid, and low levels
- Flow EMA Line: Line showing flow EMA for trend context
- Comprehensive Dashboard: 12-row intelligence panel with all temporal flow metrics
The visual system is designed for clarity with minimal clutter - only significant events are marked, and backgrounds are very subtle to avoid distraction.
Input Parameters
Temporal Settings:
- Flow Period: Period for flow calculation (10-50, default 20)
- Session Length: Bars for session analysis (10-100, default 24)
- Momentum Length: Period for momentum (5-30, default 14)
- Volume Flow Period: Period for volume flow (5-30, default 10)
Features:
- Price Flow Direction: Toggle flow analysis (default enabled)
- Session Analysis: Toggle session detection (default enabled)
- Temporal Momentum: Toggle momentum tracking (default enabled)
- Volume Flow: Toggle volume analysis (default enabled)
- Time-Based Zones: Toggle premium/discount zones (default enabled)
- Flow Shift Signals: Toggle shift detection (default enabled)
- Flow Divergence: Toggle divergence detection (default enabled)
- Session Breakouts: Toggle breakout signals (default enabled)
Sessions:
- Asian Session Start: Hour in UTC (0-23, default 0)
- London Session Start: Hour in UTC (0-23, default 7)
- NY Session Start: Hour in UTC (0-23, default 12)
Colors:
All colors are fully customizable including time bull (neon cyan), time bear (neon pink), session active (gold), flow positive (neon green), flow negative (pink), momentum high (purple), accumulation (cyan), and distribution (pink).
How to Use This Indicator
Step 1: Identify Flow Direction
Check dashboard "FLOW" field showing BULLISH or BEARISH. This indicates current directional flow. Note the status (STRONG/MODERATE/WEAK) showing flow strength.
Step 2: Monitor Flow Strength
Review "STRENGTH" metric showing flow intensity. Values above 1.5 indicate strong directional flow suitable for trend-following. Values below 0.8 suggest weak flow where range-bound strategies may work better.
Step 3: Watch Flow Acceleration
Check "ACCELERATION" showing ACCELERATING, DECELERATING, or STABLE. Accelerating flow confirms trend strength. Decelerating flow warns of potential exhaustion even if flow remains positive/negative.
Step 4: Identify Active Session
Review "SESSION" field showing ASIAN, LONDON, or NY. Different sessions have different characteristics - London and NY overlap often shows highest volatility and volume.
Step 5: Assess Volume Flow
Check "VOL FLOW" showing HIGH, NORMAL, or LOW. High volume flow confirms genuine institutional participation. Low volume flow suggests retail-dominated or thin-market conditions.
Step 6: Monitor Net Pressure
Review "PRESSURE" showing BUYING or SELLING with intensity (STRONG/MODERATE/WEAK). This reveals institutional positioning - sustained buying pressure suggests accumulation, sustained selling suggests distribution.
Step 7: Check Time Zone Position
Review "TIME ZONE" showing PREMIUM, DISCOUNT, or EQUILIBRIUM with bias suggestion. Buy in discount zones, sell in premium zones for optimal risk/reward aligned with smart money concepts.
Step 8: Watch for Flow Shifts
Flow shift labels mark critical transitions. These often provide early warning of trend changes before they're obvious in price. Shifts from strong flow to opposite flow are most significant.
Step 9: Use Divergence Warnings
Flow divergence labels warn when flow is not confirming price extremes. These often precede reversals and provide high-probability counter-trend entry opportunities.
Step 10: Monitor Flow State
Check "STATE" field showing current flow condition (EXHAUSTED, SHIFTING, BULL DIV, BEAR DIV, ACCUM, DISTRIB, or FLOWING). This provides immediate context for current flow dynamics.
Best Practices
- Flow shifts with strong acceleration often mark the start of new trends
- Session breakouts during London/NY overlap offer highest-probability setups
- Accumulation in discount zones and distribution in premium zones are most reliable
- Flow divergences at extreme momentum levels (>70 or <30) are most significant
- Flow exhaustion signals work best when combined with time zone extremes
- Strong volume flow confirmation separates genuine moves from false signals
- Temporal pressure above 2.0 or below -2.0 often precedes significant moves
- Flow velocity acceleration provides early entry timing before flow shift is obvious
- Session high/low levels often provide support/resistance for intraday trading
- Multiple flow shifts in short period suggest choppy conditions - reduce position size
- Flow strength above 2.0 in discount zones offers optimal long entry conditions
- Flow deceleration in premium zones warns of potential distribution
Indicator Limitations
- Session detection uses UTC hours which may not align perfectly with actual market hours
- Flow analysis works best on instruments with consistent intraday patterns
- Volume flow requires accurate volume data - some instruments have unreliable volume
- Time zone analysis assumes session ranges are meaningful - may not apply to all instruments
- Flow shifts can whipsaw during genuinely transitional periods
- Accumulation/distribution detection uses strict criteria - may miss some institutional activity
- Flow divergences can persist longer than expected before price reverses
- Session breakouts can be false - always use stop losses
- The indicator shows flow dynamics but cannot predict news events or fundamental catalysts
- Temporal pressure can remain extreme during strong trends
- Flow exhaustion signals are warnings, not guarantees of reversal
Technical Implementation
Built with Pine Script v6 using:
- Dual-EMA flow calculation with ATR-normalized strength measurement
- Session detection using hour() function with customizable UTC start times
- Session high/low tracking with reset on new session detection
- RSI-based momentum with flow-weighted calculations
- Volume flow analysis with buying/selling pressure separation
- Net pressure calculation using EMA smoothing
- Time zone position analysis using session range calculations
- Flow shift detection using directional comparison
- Strict accumulation/distribution criteria combining volume, price action, and momentum
- Flow divergence detection using lookback comparison with strength filtering
- Flow exhaustion identification combining strength and acceleration thresholds
- Temporal pressure calculation integrating flow, volume, and strength
- Flow velocity tracking with EMA smoothing and divergence calculation
- Comprehensive dashboard with 12 metrics and color-coded status indicators
- Minimal label system preventing chart clutter while maintaining signal visibility
The code is fully open-source with detailed comments explaining temporal flow concepts.
Originality Statement
This indicator is original in its comprehensive temporal flow analysis approach. While individual components (flow, sessions, momentum, volume) are established concepts, this indicator is justified because:
- It integrates price flow, session analysis, momentum, and volume flow into a unified temporal framework
- The flow shift detection system provides early warning of directional changes
- Accumulation/distribution detection uses strict multi-factor criteria ensuring institutional-grade signals
- Flow divergence analysis identifies price-flow asymmetries with strength filtering
- Flow exhaustion detection combines strength and acceleration for climax move identification
- Temporal pressure calculation synthesizes multiple flow dimensions into unified intensity metric
- Time zone position analysis provides smart money context for entry timing
- Session breakout detection with volume confirmation identifies high-probability setups
- The comprehensive dashboard synthesizes 12 distinct metrics into unified temporal intelligence
- Flow velocity and acceleration tracking provides early momentum shift detection
Each component reveals different temporal dynamics: flow shows direction, sessions provide timing, momentum shows strength, volume confirms participation, time zones show value, shifts warn of changes, divergences signal reversals, exhaustion marks climaxes, and pressure quantifies intensity. The indicator's value lies in combining these complementary perspectives into a cohesive temporal flow analysis system.
Disclaimer
This indicator is provided for educational and informational purposes only. It is not financial advice or a recommendation to buy or sell any financial instrument. Trading involves substantial risk of loss and is not suitable for all investors.
Temporal flow analysis is a tool for understanding time-based market dynamics, not a crystal ball for predicting future price movement. Flow shifts do not guarantee trend changes. Session breakouts do not guarantee continuation. Past flow patterns do not guarantee future flow patterns. Market conditions change, and strategies that worked historically may not work in the future.
The metrics displayed are mathematical calculations based on current market data, not predictions of future price movement. Flow shifts, divergences, exhaustion signals, and session breakouts do not guarantee profitable trades. Users must conduct their own analysis and risk assessment before making trading decisions.
Always use proper risk management, including stop losses and position sizing appropriate for your account size and risk tolerance. Never risk more than you can afford to lose. Consider consulting with a qualified financial advisor before making investment decisions.
The author is not responsible for any losses incurred from using this indicator. Users assume full responsibility for all trading decisions made using this tool.
-Made with passion by officialjackofalltrades
Скрипт с открытым кодом
В истинном духе TradingView, создатель этого скрипта сделал его открытым исходным кодом, чтобы трейдеры могли проверить и убедиться в его функциональности. Браво автору! Вы можете использовать его бесплатно, но помните, что перепубликация кода подчиняется нашим Правилам поведения.

The AI Trading Ecosystem, Built to win trades 📈
Get Full Access 👇
jackofalltrades.vip 🌐
t.me/jackofalltradesvip 🃏
Get Full Access 👇
jackofalltrades.vip 🌐
t.me/jackofalltradesvip 🃏
Отказ от ответственности
Информация и публикации не предназначены для предоставления и не являются финансовыми, инвестиционными, торговыми или другими видами советов или рекомендаций, предоставленных или одобренных TradingView. Подробнее читайте в Условиях использования.
Скрипт с открытым кодом
В истинном духе TradingView, создатель этого скрипта сделал его открытым исходным кодом, чтобы трейдеры могли проверить и убедиться в его функциональности. Браво автору! Вы можете использовать его бесплатно, но помните, что перепубликация кода подчиняется нашим Правилам поведения.
The AI Trading Ecosystem, Built to win trades 📈
Get Full Access 👇
jackofalltrades.vip 🌐
t.me/jackofalltradesvip 🃏
Get Full Access 👇
jackofalltrades.vip 🌐
t.me/jackofalltradesvip 🃏
Отказ от ответственности
Информация и публикации не предназначены для предоставления и не являются финансовыми, инвестиционными, торговыми или другими видами советов или рекомендаций, предоставленных или одобренных TradingView. Подробнее читайте в Условиях использования.