OPEN-SOURCE SCRIPT
Multi-Timeframe RSI Regime Oscillator
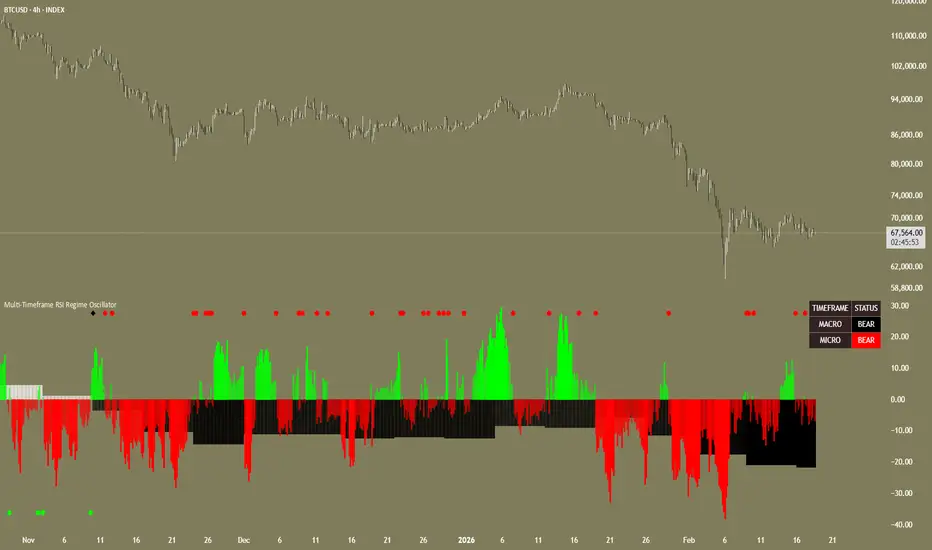
What this indicator does
This oscillator separates market analysis into two hierarchical layers — a macro regime layer and a micro timing layer — using RSI computed across two independent timeframes. Instead of plotting raw RSI values or overlaying multiple oscillators for manual interpretation, it enforces a structural dependency between the two layers through a mechanism I call a "regime gate."
The macro layer determines the dominant directional state of the market: bullish, bearish, or neutral. The micro layer then operates exclusively within the boundaries set by the macro. When the macro has not committed to a direction, the micro layer is physically suppressed — it produces no output, no bars, no signals, nothing. This creates a built-in decision hierarchy: the macro answers "should I be looking for trades right now and in which direction?" while the micro answers "is this a good moment to act within that direction?"
The output is a dual-layer column oscillator where macro bars represent the higher-timeframe regime strength and micro bars represent lower-timeframe momentum confirmation, stacked visually so you can see both layers simultaneously. A status matrix table provides a text summary of the current state of each layer.
Four signal types are generated at specific state-transition moments, and seven alert conditions allow automated monitoring.
How it works
The central concept that drives this indicator is the regime gate, a binary permission system where the macro timeframe acts as an on/off switch for the micro timeframe. This is not a filter or a weight — it is a hard suppression. Here is how each component operates:
Macro regime classification
The macro RSI (computed on the user-selected higher timeframe) is compared against two configurable thresholds: an upper threshold and a lower threshold.
-If the macro RSI is at or above the upper threshold, the regime is classified as bullish.
-If the macro RSI is at or below the lower threshold, the regime is classified as bearish.
-If the macro RSI falls between the two thresholds, the regime is classified as neutral.
When both thresholds are set to the same value (the default configuration uses 50/50), there is no gap between them, which means the macro is always in a resolved directional state — it is either bullish or bearish at all times, and the neutral zone does not exist. This is intentional for the default setup: it ensures the micro layer is always active and the oscillator always has directional output.
When the thresholds are separated (for example, upper at 60 and lower at 40), a neutral zone is created. Any macro RSI reading between 40 and 60 would suppress the entire micro layer and flatten the oscillator to zero. This configuration is useful when you want the indicator to explicitly tell you "the higher timeframe is inconclusive — stay out."
The width of this neutral zone directly controls how much higher-timeframe conviction is required before the indicator begins producing actionable output. A narrow gap (55/45) allows the regime to resolve quickly with modest momentum. A wide gap (65/35) demands strong directional commitment from the higher timeframe before any micro signals can appear. This is a design parameter that the trader tunes based on their tolerance for ambiguity versus their desire for early positioning.
Delta-from-threshold encoding
Rather than displaying the raw RSI value, the oscillator displays the distance (delta) the RSI has traveled beyond its threshold. If the macro RSI is 72 and the upper threshold is 50, the oscillator shows +22. If the macro RSI is 33 and the lower threshold is 50, the oscillator shows -17.
This encoding carries information that a raw RSI plot does not. On a standard RSI chart, a reading of 55 and a reading of 85 both appear in the "bullish" zone — the only difference is vertical position on the scale. On this oscillator, those same conditions produce bars of dramatically different heights (5 vs 35 with a threshold of 50), making the momentum differential immediately visually apparent. Taller bars mean the RSI has pushed significantly beyond the minimum regime requirement; shorter bars mean the regime is active but momentum is modest.
During a neutral macro period (when thresholds are separated), the oscillator outputs exactly zero — a flat line. This flat state is itself a signal: it communicates that the higher timeframe has not committed, and the indicator is intentionally withholding output rather than generating noise.
Micro layer gating
When the macro regime is resolved (bullish or bearish), the micro RSI is evaluated against its own independent set of thresholds. Critically, these micro thresholds operate asymmetrically relative to the macro direction:
During a macro bull regime, only the micro upper threshold matters. If the micro RSI exceeds it, the micro oscillator produces positive bars showing the delta above threshold. If the micro RSI is below its upper threshold, the micro oscillator is zero — the micro is "waiting" for momentum alignment.
During a macro bear regime, only the micro lower threshold matters. If the micro RSI drops below it, the micro oscillator produces negative bars. Otherwise, the micro is silent.
This means the micro layer can never produce a bullish signal during a macro bear regime or a bearish signal during a macro bull regime. Cross-regime signals are structurally impossible. The architecture enforces directional discipline that does not depend on the trader's judgment in the moment.
When the macro is neutral (if a neutral zone exists in the threshold configuration), the micro layer produces zero output regardless of what the micro RSI is doing. The gate is closed.
Signal generation logic
The indicator produces four distinct signal types, each firing at a specific state-transition moment:
Macro buy signal (diamond at bottom): fires on the exact bar where the macro RSI first crosses above the upper threshold after being below it. This marks the birth of a new bullish regime. It fires once per transition — it will not fire again as long as the macro remains bullish, even if the RSI fluctuates above the threshold.
Macro sell signal (diamond at top): fires on the exact bar where the macro RSI first crosses below the lower threshold after being above it. Marks the start of a new bearish regime.
Micro buy signal (circle at bottom): fires when the micro RSI first crosses above its upper threshold while the macro regime is already bullish. This represents the moment when the lower timeframe's momentum aligns with the higher timeframe's directional commitment. Multiple micro buy signals can fire within a single macro bull regime if the micro RSI dips below and then re-crosses above its threshold.
Micro sell signal (circle at top): fires when the micro RSI first crosses below its lower threshold while the macro regime is already bearish. Multiple micro sell signals can occur within a single macro bear regime.
The distinction between these signal types reflects different analytical questions. Macro signals answer "has the environment changed?" Micro signals answer "is now a good time to act within this environment?" A trader might use macro signals for portfolio-level directional decisions and micro signals for position entry timing.
How the two layers interact
This is not two independent RSI indicators placed on the same pane. The macro and micro layers have a defined parent-child dependency that neither can replicate alone:
The macro layer alone would tell you the regime direction and its strength, but it operates on a slow timeframe and cannot provide entry precision. You would know the daily trend is bullish but not whether this specific 4-hour candle represents a good entry or a temporary exhaustion.
The micro layer alone would produce momentum signals on the faster timeframe, but without directional filtering, it would generate signals in both directions regardless of the higher-timeframe context. You would get buy signals during a weekly downtrend and sell signals during a weekly uptrend — noise that the trader must manually filter.
The regime gate solves both problems simultaneously. The macro provides directional context that the micro cannot generate on its own. The micro provides timing precision that the macro is too slow to offer. The gate ensures that micro-output only exists when the macro has given directional permission. Neither layer is useful without the other — their value is entirely in their structured interaction.
Visual components
-Dual-layer column oscillator: Macro bars (wider, behind) show the macro delta. Micro bars (narrower, in front) show the micro delta. Both occupy the same pane, stacked by plotting order. When only the macro is active but the micro RSI hasn't reached its threshold, you see macro bars without micro bars — visually indicating "regime is active but micro hasn't confirmed yet."
-Gradient mode: When enabled, bar colors scale from faded (near threshold) to fully saturated (deep into momentum territory). This adds a third dimension of information — not just direction and whether the threshold is crossed, but how emphatically it is crossed.
-Status matrix: A two-row table showing "BULL," "BEAR," or "NEUTRAL" for each layer. Turquoise indicates neutral, white indicates macro bull, black indicates macro bear, green indicates micro bull, red indicates micro bear. The table updates on each bar and provides an unambiguous text readout when the oscillator bars might be small or visually unclear.
-Background fills: Optional background coloring for both macro and micro states, useful for scanning multiple charts quickly to identify which instruments are in which regime.
-Signal markers: Diamonds for macro regime transitions, circles for micro momentum-alignment events. Shape distinction allows instant visual differentiation of signal type without color interpretation.
How to use it
Identifying the regime:
When macro bars appear and the matrix shows "BULL" or "BEAR," the higher timeframe has declared a directional state. The height of the macro bars tells you how far beyond the minimum threshold the momentum has pushed — taller bars suggest more committed momentum. Trade only in the macro direction until the regime transitions.
Timing entries:
Within an active regime, monitor for micro signals (circle markers). A micro buy circle during a macro bull regime means: the daily trend is up AND the 4-hour momentum just kicked in the same direction. This dual-timeframe confirmation is the indicator's primary trade-timing mechanism.
Reading the neutral state:
If you configure separated thresholds (e.g., macro upper 60, lower 40), the oscillator will flatten to zero when the daily RSI is between 40 and 60. This is a designed no-trade condition. The flat state is not a malfunction — it is the indicator communicating that the higher timeframe is inconclusive and you should wait for a regime to resolve before seeking entries.
Re-entry opportunities:
Within a sustained macro regime, the micro RSI may dip below its threshold and then re-cross above it multiple times. Each re-crossing generates a new micro signal. These represent pullback-to-continuation opportunities within the dominant trend — the micro momentum temporarily waned, then re-aligned with the macro direction.
Regime transition awareness:
When a macro diamond signal appears (regime change), it marks a structural shift. The previous micro signals from the old regime are no longer relevant. The new regime may or may not produce immediate micro signals — the micro needs time to cross its own threshold in the new direction.
Threshold configuration guidelines
The relationship between macro and micro thresholds shapes the indicator's behavior -profile:
-Macro 50/50 (default): No neutral zone. The macro is always directional. The oscillator always has output. Best for traders who want continuous regime classification without dead periods.
-Macro 55/45: Small neutral zone. Filters out the weakest directional readings. Minor reduction in noise, minor increase in entry latency.
-Macro 60/40: Moderate neutral zone. Requires meaningful momentum before declaring a regime. Significant noise reduction in ranging markets. Entries come later but with higher conviction.
-Macro 65/35: Wide neutral zone. Only declares a regime during strong directional moves. Many instruments will spend substantial time in the neutral state. Best for traders who prefer fewer, higher-conviction setups.
-Micro thresholds (default 60/40) control how much micro momentum is needed for timing signals. Raising the micro upper to 65 or 70 filters for stronger continuation momentum. Lowering it to 55 allows earlier micro signals at the cost of more false starts.
Alert conditions
Seven alert conditions are available:
-Macro bullish regime start
-Macro bearish regime start
-Micro bullish momentum alignment
-Micro bearish momentum alignment
-Any macro regime change (combines both macro signals)
-Any micro alignment signal (combines both micro signals)
-Any signal of any type (fires on any of the four conditions)
These allow fully automated monitoring across watchlists. A typical setup might use "Any Macro Regime Change" on a broad watchlist to identify instruments entering new trends, then "Micro Bullish Momentum Alignment" on the filtered shortlist for entry timing.
Suitable markets and trading styles
This indicator works on any liquid market: forex pairs, cryptocurrency, equities, futures, and indices. The timeframe pairing determines the trading style:
Position trading and investing (trend-following approach): Weekly macro with daily micro. Captures major trend regime shifts and times entries on daily momentum confirmation. Signals are infrequent but represent significant directional commitment across both timeframes.
Swing trading: Daily macro with 4-hour micro. The default configuration. Identifies daily trend direction and times entries on 4-hour momentum alignment. Suitable for holding periods of several days to weeks.
Day trading: 4-hour macro with 1-hour or 30-minute micro. Identifies the intraday directional bias from the 4-hour structure and times entries on shorter-term momentum within that session's trend.
Momentum-continuation scalping: 15-minute macro with 5-minute micro, or 5-minute macro with 1-minute micro. This is specifically suited for scalping methods that trade with the prevailing micro-trend rather than counter-trend fading. The regime gate prevents taking long scalps during short-term downtrends and vice versa. Not suitable for mean-reversion or fade scalping strategies.
The wider the timeframe spread between macro and micro, the fewer signals generated but the higher the conviction per signal. The narrower the spread, the more responsive and frequent the output, with correspondingly more noise.
Technical notes
The RSI calculation is the standard Wilder RSI, available as a TradingView built-in and considered public domain. Multi-timeframe data retrieval uses request.security() with the standard confirmed-close anti-repaint pattern ([1] offset combined with barmerge.lookahead_on). When "Candle Close Confirmation" is enabled (default), higher-timeframe values only update after the candle closes, preventing repainting at the cost of one bar of delay on the higher timeframe.
The regime gate architecture, delta-from-threshold oscillator encoding, dual-layer visual stacking, state-transition signal logic, and the structural suppression of the micro layer by macro state are original to this indicator.
Disclaimer
This indicator is an analytical tool for visualizing momentum regime states across timeframes. It does not constitute financial advice, does not guarantee profitable outcomes, and should not be used as the sole basis for trading decisions. All trading and investing involves risk of capital loss. Use this tool alongside proper risk management, position sizing, and your own analysis. Past signal behavior does not predict future results. The trader is solely responsible for all decisions made using this tool.
Скрипт с открытым кодом
В истинном духе TradingView, создатель этого скрипта сделал его открытым исходным кодом, чтобы трейдеры могли проверить и убедиться в его функциональности. Браво автору! Вы можете использовать его бесплатно, но помните, что перепубликация кода подчиняется нашим Правилам поведения.

Отказ от ответственности
Информация и публикации не предназначены для предоставления и не являются финансовыми, инвестиционными, торговыми или другими видами советов или рекомендаций, предоставленных или одобренных TradingView. Подробнее читайте в Условиях использования.
Скрипт с открытым кодом
В истинном духе TradingView, создатель этого скрипта сделал его открытым исходным кодом, чтобы трейдеры могли проверить и убедиться в его функциональности. Браво автору! Вы можете использовать его бесплатно, но помните, что перепубликация кода подчиняется нашим Правилам поведения.
Отказ от ответственности
Информация и публикации не предназначены для предоставления и не являются финансовыми, инвестиционными, торговыми или другими видами советов или рекомендаций, предоставленных или одобренных TradingView. Подробнее читайте в Условиях использования.