OPEN-SOURCE SCRIPT
Обновлено Failed Pullback Reversal Planner [AGPro Series]
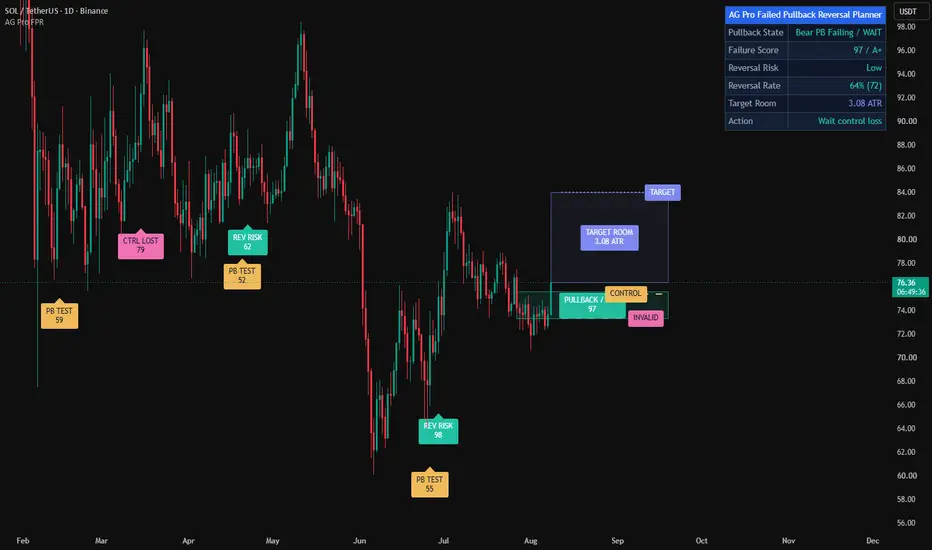
Failed Pullback Reversal Planner [AGPro Series]
🧠 Core Idea
Did the pullback fail to recover, and is it now creating a reversal-warning context?
📌 Overview / What it does
Failed Pullback Reversal Planner [AGPro Series] is a chart-first reversal risk planner built for one specific situation: a pullback inside an existing trend stops behaving like a healthy retracement and begins losing control.
The script maps a failed pullback pocket, control-loss rail, invalidation reference, target-room guide, compact state labels, alerts, and a clean AG Pro panel. It converts pullback depth, failed recovery, close behavior, volume response, and follow-through into a 0-100 Failure Score.
It does not predict future price movement, automate entries, or issue guaranteed buy/sell signals. Its role is to organize failed-pullback context into a clearer decision framework.
🎯 Purpose & Design Philosophy
This script was built because many pullback tools only focus on continuation quality. They often ask whether the pullback is healthy enough to resume the original trend.
Failed Pullback Reversal Planner focuses on the opposite decision layer. It asks whether the pullback failed to recover, lost the control reference, and now deserves reversal-risk review.
The design supports traders who want cleaner structure, risk location, target-room context, and next-action guidance without turning every candle into a signal.
⚡ Why This Script Is Different
Most tools focus on pullback continuation, moving-average bounces, or generic reversal markers.
This script does NOT clone Pullback Acceptance Planner, Low Volume Pullback Zones, Trend Continuation Quality, or a generic reversal signal indicator.
Instead, it treats failed pullbacks as a planning problem. Price must first enter a pullback context, then fail recovery around a control rail, then show enough close quality, volume response, and follow-through to raise reversal-risk state.
⚙️ Methodology
1. Context Detection
The script identifies former bullish or bearish trend context using fast, base, and slow EMA alignment.
2. Reference Mapping
It builds a failed pullback pocket, control-loss rail, invalidation reference, and target-room guide using ATR-normalized logic.
3. Reaction Evaluation
It scores pullback depth, failed recovery, close against the former trend, volume response, and nearby follow-through.
4. Visual Output
It displays concept-native zones, centered zone labels, compact event labels, guide rails, alerts, and a premium AG Pro planning panel.
🗺️ How to Read the Chart
Zones = the failed pullback pocket and reversal-risk zone.
Labels = pullback test, control-loss, reversal-risk, or reset markers.
Colors = teal shows bullish reversal-risk context, pink shows bearish reversal-risk context, amber shows watch context, red shows control-loss or risk context, and indigo shows reset/recovery context.
Panel = a compact decision dashboard showing Pullback State, Failure Score, Reversal Risk, Invalidation, and Action.
🚦 Signals & States
• PB TEST → a recent pullback is being monitored for failed-recovery behavior.
• CTRL LOST → price has lost the control reference but has not fully qualified the warning state.
• REV RISK → failed pullback context has enough score to deserve reversal-risk review.
• RESET → optional marker showing that price reclaimed the invalidation reference and the failed-pullback plan should be reset.
• NO SETUP → no active failed-pullback context is present.
🔔 Alerts Logic
Alerts trigger when the planner detects a monitored failed-pullback setup, a reversal-risk warning, invalidation/reset behavior, or meaningful follow-through after control loss.
Alerts are attention markers only. They are not trade instructions.
🧩 Confluence Logic
The strongest failed-pullback context appears when pullback depth is meaningful, price loses the control rail, the candle closes against the former trend, volume supports the shift, and follow-through begins beyond nearby structure.
When these components align, the Failure Score rises and the panel moves from watch context toward reversal-risk review.
📊 When to Use
• Trend pullbacks that start losing recovery quality
• Potential reversal transitions after a failed retracement
• Markets where a prior trend is weakening around a control reference
• Situations where invalidation and target-room context matter
⚠️ When NOT to Use
• Very low liquidity markets
• Extremely noisy sideways conditions
• News-driven volatility spikes
• Markets with no clean prior trend context
• Symbols where volume behavior is unreliable
🎛️ Key Inputs
• Sensitivity → controls how strict the failed-pullback model is.
• Former Trend Side → restricts evaluation to bullish-trend or bearish-trend failures when needed.
• Failure Window Bars → defines how long after a pullback touch control-loss behavior can qualify.
• Control-Loss Buffer ATR → adjusts the rail used to mark failed recovery.
• Invalidation Buffer ATR → controls the reset reference beyond the fast trend anchor.
• Label and Panel Settings → control panel location, theme, font size, label size, label spacing, and visible label count.
🖥️ Interface & Visual Design
The interface is built around a clean AG Pro decision panel and chart-first planning visuals.
The first panel row uses the AG Pro merged blue header standard with only the script name. The remaining rows focus on the active decision: pullback state, failure score, reversal risk, invalidation, and action.
The chart uses a focused failed pullback pocket, a reversal-risk zone, guide rails, and compact labels. The goal is a premium planning view without crowded generic signals.
🧪 Practical Usage Workflow
1. Read the panel state.
2. Check whether a pullback test is active.
3. Watch whether price loses the control rail.
4. Review the Failure Score and reversal-risk label.
5. Compare the invalidation reference and target-room guide before interpreting the context.
🔍 Interpretation Guidelines
Think in terms of failed recovery quality, not prediction.
A higher Failure Score means the current pullback has stronger failed-recovery characteristics across depth, control loss, close behavior, volume, and follow-through.
A control-loss state means the setup is weakening but may still need more confirmation.
A reset state means the failed-pullback idea has been reclaimed and should be reassessed.
🚫 What This Script Is NOT
• Not a prediction engine
• Not financial advice
• Not auto trading
• Not guaranteed signals
• Not a generic pullback continuation indicator
⚠️ Limitations & Transparency
• Timeframe differences can change how pullback depth and failure windows appear.
• High volatility can distort ATR-normalized rails.
• Low-volume instruments may reduce the reliability of the volume component.
• Sideways markets can create repeated failed-pullback noise.
• Outputs should be interpreted with broader market structure.
🧠 Market Context Notes
Failed pullbacks often matter when a market was expected to recover in the direction of the prior trend but instead loses the control reference.
The script does not assume that every failed recovery becomes a full reversal. It simply marks when the context is strong enough to deserve review.
🧾 Use Case Examples
When a bullish trend pulls back toward the fast/base EMA area, fails to recover, and closes below the control rail with stronger participation, the planner may raise bearish reversal-risk context.
When a bearish trend pulls back upward, fails to reject lower, and closes above the control rail with follow-through, the planner may raise bullish reversal-risk context.
🧱 System Philosophy
The script is built around decision quality. It does not try to add another signal layer. It asks whether a specific market behavior is valid, how strong it is, where it is invalidated, and what should be reviewed next.
🔐 Non-Promise Statement
No guarantees.
No certainty.
The script organizes observable market behavior into a structured analytical view.
📉 Risk Disclosure
Trading involves risk.
Users are responsible for their own analysis, risk management, and decisions.
This script does not provide financial advice or guaranteed trading outcomes.
📚 Educational Note
Use the planner as an educational framework for studying failed pullbacks, recovery quality, control loss, and reversal-risk context.
🧠 Core Idea
Did the pullback fail to recover, and is it now creating a reversal-warning context?
📌 Overview / What it does
Failed Pullback Reversal Planner [AGPro Series] is a chart-first reversal risk planner built for one specific situation: a pullback inside an existing trend stops behaving like a healthy retracement and begins losing control.
The script maps a failed pullback pocket, control-loss rail, invalidation reference, target-room guide, compact state labels, alerts, and a clean AG Pro panel. It converts pullback depth, failed recovery, close behavior, volume response, and follow-through into a 0-100 Failure Score.
It does not predict future price movement, automate entries, or issue guaranteed buy/sell signals. Its role is to organize failed-pullback context into a clearer decision framework.
🎯 Purpose & Design Philosophy
This script was built because many pullback tools only focus on continuation quality. They often ask whether the pullback is healthy enough to resume the original trend.
Failed Pullback Reversal Planner focuses on the opposite decision layer. It asks whether the pullback failed to recover, lost the control reference, and now deserves reversal-risk review.
The design supports traders who want cleaner structure, risk location, target-room context, and next-action guidance without turning every candle into a signal.
⚡ Why This Script Is Different
Most tools focus on pullback continuation, moving-average bounces, or generic reversal markers.
This script does NOT clone Pullback Acceptance Planner, Low Volume Pullback Zones, Trend Continuation Quality, or a generic reversal signal indicator.
Instead, it treats failed pullbacks as a planning problem. Price must first enter a pullback context, then fail recovery around a control rail, then show enough close quality, volume response, and follow-through to raise reversal-risk state.
⚙️ Methodology
1. Context Detection
The script identifies former bullish or bearish trend context using fast, base, and slow EMA alignment.
2. Reference Mapping
It builds a failed pullback pocket, control-loss rail, invalidation reference, and target-room guide using ATR-normalized logic.
3. Reaction Evaluation
It scores pullback depth, failed recovery, close against the former trend, volume response, and nearby follow-through.
4. Visual Output
It displays concept-native zones, centered zone labels, compact event labels, guide rails, alerts, and a premium AG Pro planning panel.
🗺️ How to Read the Chart
Zones = the failed pullback pocket and reversal-risk zone.
Labels = pullback test, control-loss, reversal-risk, or reset markers.
Colors = teal shows bullish reversal-risk context, pink shows bearish reversal-risk context, amber shows watch context, red shows control-loss or risk context, and indigo shows reset/recovery context.
Panel = a compact decision dashboard showing Pullback State, Failure Score, Reversal Risk, Invalidation, and Action.
🚦 Signals & States
• PB TEST → a recent pullback is being monitored for failed-recovery behavior.
• CTRL LOST → price has lost the control reference but has not fully qualified the warning state.
• REV RISK → failed pullback context has enough score to deserve reversal-risk review.
• RESET → optional marker showing that price reclaimed the invalidation reference and the failed-pullback plan should be reset.
• NO SETUP → no active failed-pullback context is present.
🔔 Alerts Logic
Alerts trigger when the planner detects a monitored failed-pullback setup, a reversal-risk warning, invalidation/reset behavior, or meaningful follow-through after control loss.
Alerts are attention markers only. They are not trade instructions.
🧩 Confluence Logic
The strongest failed-pullback context appears when pullback depth is meaningful, price loses the control rail, the candle closes against the former trend, volume supports the shift, and follow-through begins beyond nearby structure.
When these components align, the Failure Score rises and the panel moves from watch context toward reversal-risk review.
📊 When to Use
• Trend pullbacks that start losing recovery quality
• Potential reversal transitions after a failed retracement
• Markets where a prior trend is weakening around a control reference
• Situations where invalidation and target-room context matter
⚠️ When NOT to Use
• Very low liquidity markets
• Extremely noisy sideways conditions
• News-driven volatility spikes
• Markets with no clean prior trend context
• Symbols where volume behavior is unreliable
🎛️ Key Inputs
• Sensitivity → controls how strict the failed-pullback model is.
• Former Trend Side → restricts evaluation to bullish-trend or bearish-trend failures when needed.
• Failure Window Bars → defines how long after a pullback touch control-loss behavior can qualify.
• Control-Loss Buffer ATR → adjusts the rail used to mark failed recovery.
• Invalidation Buffer ATR → controls the reset reference beyond the fast trend anchor.
• Label and Panel Settings → control panel location, theme, font size, label size, label spacing, and visible label count.
🖥️ Interface & Visual Design
The interface is built around a clean AG Pro decision panel and chart-first planning visuals.
The first panel row uses the AG Pro merged blue header standard with only the script name. The remaining rows focus on the active decision: pullback state, failure score, reversal risk, invalidation, and action.
The chart uses a focused failed pullback pocket, a reversal-risk zone, guide rails, and compact labels. The goal is a premium planning view without crowded generic signals.
🧪 Practical Usage Workflow
1. Read the panel state.
2. Check whether a pullback test is active.
3. Watch whether price loses the control rail.
4. Review the Failure Score and reversal-risk label.
5. Compare the invalidation reference and target-room guide before interpreting the context.
🔍 Interpretation Guidelines
Think in terms of failed recovery quality, not prediction.
A higher Failure Score means the current pullback has stronger failed-recovery characteristics across depth, control loss, close behavior, volume, and follow-through.
A control-loss state means the setup is weakening but may still need more confirmation.
A reset state means the failed-pullback idea has been reclaimed and should be reassessed.
🚫 What This Script Is NOT
• Not a prediction engine
• Not financial advice
• Not auto trading
• Not guaranteed signals
• Not a generic pullback continuation indicator
⚠️ Limitations & Transparency
• Timeframe differences can change how pullback depth and failure windows appear.
• High volatility can distort ATR-normalized rails.
• Low-volume instruments may reduce the reliability of the volume component.
• Sideways markets can create repeated failed-pullback noise.
• Outputs should be interpreted with broader market structure.
🧠 Market Context Notes
Failed pullbacks often matter when a market was expected to recover in the direction of the prior trend but instead loses the control reference.
The script does not assume that every failed recovery becomes a full reversal. It simply marks when the context is strong enough to deserve review.
🧾 Use Case Examples
When a bullish trend pulls back toward the fast/base EMA area, fails to recover, and closes below the control rail with stronger participation, the planner may raise bearish reversal-risk context.
When a bearish trend pulls back upward, fails to reject lower, and closes above the control rail with follow-through, the planner may raise bullish reversal-risk context.
🧱 System Philosophy
The script is built around decision quality. It does not try to add another signal layer. It asks whether a specific market behavior is valid, how strong it is, where it is invalidated, and what should be reviewed next.
🔐 Non-Promise Statement
No guarantees.
No certainty.
The script organizes observable market behavior into a structured analytical view.
📉 Risk Disclosure
Trading involves risk.
Users are responsible for their own analysis, risk management, and decisions.
This script does not provide financial advice or guaranteed trading outcomes.
📚 Educational Note
Use the planner as an educational framework for studying failed pullbacks, recovery quality, control loss, and reversal-risk context.
Информация о релизе
UPDATE NOTES - V1.3This update focuses on best-view guidance and publication screenshot clarity.
The core purpose of the script remains unchanged.
This release adds explicit 15-minute best-view guidance to the panel because the failed-pullback label rhythm and reversal context read most cleanly on the 15-minute chart.
This script continues to function as an analytical and visualization tool.
It does not attempt to predict price direction or provide guaranteed outcomes.
------------------------
What Changed
------------------------
* Added Best View panel row
The panel now shows whether the current chart is the preferred 15-minute view or whether the user should switch to 15m.
* Preserved V1.2 close-zone overlap fix
The automatic close-zone text merge remains active when the failed pocket and risk zone are too close.
* Kept the 15-minute publication look
Default label density, cooldown, and max visible labels remain tuned for a chart that feels active without becoming crowded.
* Preserved target-room context
The target-room corridor remains part of the primary visual story.
------------------------
Visual Improvements
------------------------
* Improved panel guidance for the timeframe where the script has the strongest visual presentation
* Preserved balanced label density for 15-minute public screenshots
* Maintained clean zone text behavior from V1.2
* Kept the chart-first layout focused on failed-pullback risk, not generic reversal signals
------------------------
Interface & Usability
------------------------
* Panel now includes a Best View row
* 15-minute charts display 15m Active
* Other intraday or higher-timeframe charts display Use 15m
* Existing panel theme, location, and font-size controls remain unchanged
------------------------
Behavior Notes
------------------------
This update does not change the core analytical logic of the script.
The goal is to improve visual guidance and publication readiness, not to introduce predictive behavior.
Users should interpret outputs the same way as before, but with clearer guidance about the strongest default viewing timeframe.
------------------------
Limitations Reminder
------------------------
The script remains a rule-based analytical tool.
Market conditions such as volatility, liquidity, trend maturity, and timeframe differences may affect how failed-pullback states appear.
Outputs should always be interpreted within broader market context.
------------------------
Risk Reminder
------------------------
This script is for educational and analytical purposes only.
It does not provide financial advice or guaranteed trading outcomes.
Users remain responsible for their own decisions.
Информация о релизе
UPDATE NOTES - V1.5This update focuses on restoring the stronger original zone presentation while refining the zone labels for cleaner publication readability.
The core purpose of the script remains unchanged.
This release improves how the existing failed-pullback reversal logic is presented, organized, and interpreted on the chart.
This script continues to function as an analytical and visualization tool.
It does not attempt to predict price direction or provide guaranteed outcomes.
------------------------
What Changed
------------------------
* Restored Full Path target-room geometry as the default.
The larger target-room corridor is more visually expressive and closer to the original script character.
* Preserved Compact Rail mode as an optional setting.
Users who prefer the smaller target guide can still select it manually.
* Restored guide rails as part of the default visual story.
Control, invalidation, and target guide rails support the planner context without removing any existing capability.
* Restored broader forward projection and stronger zone opacity.
The active zones now feel closer to the previous visual identity.
* Refined zone text intent.
Zone text was moved out of native box text and into centered solid color-matched badges so it remains readable on both dark and light chart themes.
------------------------
Visual Improvements
------------------------
* Recovered the stronger original zone drawing style
* Kept zone labels centered inside the visual areas
* Replaced plain white zone text with contrast-safe color-matched badge labels
* Preserved the full target-room corridor for richer chart screenshots
* Avoided removing features while improving label readability
------------------------
Interface & Usability
------------------------
* Target-Room Style remains user-selectable
* Full Path is now the recommended default
* Compact Rail remains available for cleaner or tighter chart views
* Panel controls, label controls, alerts, and all planner features remain available
* Removed the Best View panel row because a fixed timeframe hint is not reliable for this planner
------------------------
Behavior Notes
------------------------
This update does not change the core analytical logic of the script.
The goal is to improve visual quality and readability, not to introduce new predictive behavior.
Users should interpret outputs the same way as before, but with restored zone geometry and cleaner centered zone text.
------------------------
Limitations Reminder
------------------------
The script remains a rule-based analytical tool.
Market conditions such as volatility, liquidity, and timeframe differences may affect how failed-pullback context appears.
Outputs should always be interpreted within broader market context.
------------------------
Risk Reminder
------------------------
This script is for educational and analytical purposes only.
It does not provide financial advice or guaranteed trading outcomes.
Users remain responsible for their own decisions.
Информация о релизе
🔧 UPDATE NOTES - v1.6This update adds a reversal follow-through proof and contrast-safe badge text everywhere.
The core purpose of the script remains unchanged.
It continues to study when a pullback inside a trend fails to recover, loses control, and
builds reversal-warning context, mapping the pocket, reversal-risk zone, target room and rails.
This script continues to function as an analytical and visualization tool.
It does not attempt to predict price direction or provide guaranteed outcomes.
------------------------
What Changed
------------------------
- Reversal Rate proof layer
The panel now reports how often a reversal warning historically followed through in its
expected direction rather than resetting back through invalidation, shown with the sample count.
- Reversal proof window input
A new setting controls the window used to measure post-warning follow-through.
- Honest, conservative counting
Each warning is counted once, and an invalidation reclaim first or a window expiry without
follow-through is treated as not-followed, so the rate stays realistic.
------------------------
Visual Improvements
------------------------
- Contrast-safe text on the pocket, reversal-risk and target-room badges and on every event
label, so readouts stay readable on amber, pink, teal and indigo backgrounds
- Kept the strong full-zone geometry, centered zone badges and guide rails unchanged
- Preserved controlled event and watch label spacing
- Maintained a clean, focused first-glance read of the active failed-pullback plan
------------------------
Interface & Usability
------------------------
- Added a Reversal Rate row for an at-a-glance reversal follow-through track record
- Added a window setting so the proof measures prompt follow-through
- Improved badge legibility across all states and both panel themes
- Enhanced overall user experience without changing the core planner logic
------------------------
Behavior Notes
------------------------
This update does not change the core analytical logic of the script.
The failed-pullback detection, failure score, states, zones and invalidation are unchanged. The
Reversal Rate is a separate historical track-record layer and does not alter detection.
------------------------
Limitations Reminder
------------------------
The script remains a rule-based analytical tool.
Market conditions such as volatility, liquidity and timeframe differences may affect how the
pullback, reversal context and the rate appear.
Outputs should always be interpreted within broader market context.
------------------------
Risk Reminder
------------------------
This script is for educational and analytical purposes only.
It does not provide financial advice or guaranteed trading outcomes.
Users remain responsible for their own decisions.
Информация о релизе
Version 1.7 – Confirmation Integrity and Active-Plan ClarityThis update improves confirmation consistency and the visual hierarchy of the active failed-pullback plan while preserving the script’s core reversal-risk model, scoring structure, inputs, and interpretation workflow.
• Applied the Confirm on Close setting consistently to pullback-watch, invalidation, and follow-through alert behavior so visible events respect the selected confirmation policy.
• Rebuilt overlapping pullback and risk areas as one clearly identified PULLBACK / RISK zone instead of leaving a second zone without its own visual identity.
• Added compact CONTROL, INVALID, and TARGET identifiers to every optional active guide rail, eliminating unlabeled planning lines.
• Shortened active guide rails and staggered their identifiers across the projection area to reduce collisions with candles, centered zone badges, and one another.
• Preserved centered zone labels, adjustable label and panel font sizes, the merged blue panel header, configurable panel placement and theme, historical label density controls, and all existing analytical calculations.
Скрипт с открытым кодом
В истинном духе TradingView, создатель этого скрипта сделал его открытым исходным кодом, чтобы трейдеры могли проверить и убедиться в его функциональности. Браво автору! Вы можете использовать его бесплатно, но помните, что перепубликация кода подчиняется нашим Правилам поведения.

Trading Suite | Flagship Workflow :
tradingview.com/script/XJmX3p98-Trading-Suite-AGPro-Series/
Crypto Setup Planner | Multi-Symbol Analysis :
tradingview.com/script/LgVRo7Ql-Crypto-Setup-Planner-AGPro-Series/
tradingview.com/script/XJmX3p98-Trading-Suite-AGPro-Series/
Crypto Setup Planner | Multi-Symbol Analysis :
tradingview.com/script/LgVRo7Ql-Crypto-Setup-Planner-AGPro-Series/
Отказ от ответственности
Информация и публикации не предназначены для предоставления и не являются финансовыми, инвестиционными, торговыми или другими видами советов или рекомендаций, предоставленных или одобренных TradingView. Подробнее читайте в Условиях использования.
Скрипт с открытым кодом
В истинном духе TradingView, создатель этого скрипта сделал его открытым исходным кодом, чтобы трейдеры могли проверить и убедиться в его функциональности. Браво автору! Вы можете использовать его бесплатно, но помните, что перепубликация кода подчиняется нашим Правилам поведения.
Trading Suite | Flagship Workflow :
tradingview.com/script/XJmX3p98-Trading-Suite-AGPro-Series/
Crypto Setup Planner | Multi-Symbol Analysis :
tradingview.com/script/LgVRo7Ql-Crypto-Setup-Planner-AGPro-Series/
tradingview.com/script/XJmX3p98-Trading-Suite-AGPro-Series/
Crypto Setup Planner | Multi-Symbol Analysis :
tradingview.com/script/LgVRo7Ql-Crypto-Setup-Planner-AGPro-Series/
Отказ от ответственности
Информация и публикации не предназначены для предоставления и не являются финансовыми, инвестиционными, торговыми или другими видами советов или рекомендаций, предоставленных или одобренных TradingView. Подробнее читайте в Условиях использования.