Multi-Timeframe Support / Resistance Lines
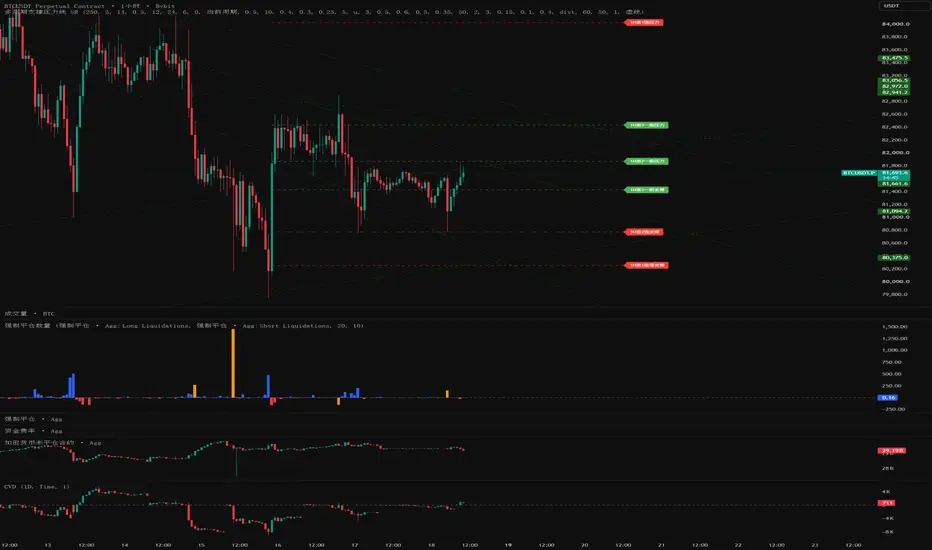
# Multi-Timeframe Support / Resistance Lines (Auto S/R Lines) — Release Notes
**Indicator name**: 多周期支撑压力线 SR (Multi-Timeframe S/R Lines)
**Version**: Pine Script v6 · overlay indicator · `max_bars_back=500`, limits: 120 lines / 120 labels / 60 boxes
**File**: `scripts/draw_kline_srlines.pine`
**Origin**: ported line-by-line from `scripts/draw_kline_srlines.mjs` (V7 Auto S/R Lines); the algorithm is aligned with the JS version
## 1. Features
Automatically detects and plots support / resistance levels on the main chart, with strength scoring, grade-based coloring, a level info table, and breakout alerts. Core capabilities:
1. **Candidate detection**
- Swing highs / lows: pivots confirmed by `Swing Window` bars on each side;
- Recent supplement: the last 30 bars are scanned again with window = 2; candidates with `quality < 0.35` are discarded;
- Rejection candidates: non-pivot bars whose same-side wick ratio (wick / bar range) and wick depth (in ATR multiples) both meet the thresholds.
2. **Side split**: by default levels are split by price relative to the latest close (above = resistance, below = support); optionally split by swing type.
3. **Clustering**: greedy merging in ascending price order, tolerance = `max(global floor, point ATR × multiplier, cluster ATR × multiplier)`; cluster center and cluster ATR are the median of members; clusters with fewer members than `Min Touches` are dropped.
4. **Scoring and grading**
- Strength = touches 25% + rejection 20% + reaction 15% + reversal 15% + volume 5% + breakout-retest 10% + swing quality 10%;
- Display score = `(1 - distance weight) × strength + distance weight × distance score` (the closer, the higher); level selection always uses the display score;
- Grades: 极强 (extreme) ≥ strong threshold + 20, 强 (strong) ≥ strong threshold, 一般 (medium) ≥ strong threshold − 20, otherwise 弱 (weak); each grade can be colored separately.
5. **Multi-timeframe (main addition of this release)**
- Data source: Current TF / Daily / 4H / 1H / 15m / **MTF Merge**;
- Higher timeframes always use `request.security(..., lookahead=barmerge.lookahead_off)`: only closed HTF bars are taken, so nothing repaints; each HTF bar is enqueued only once;
- MTF merge: each timeframe runs the full detection once, then results are clustered across timeframes by the cross-TF price tolerance; a price confirmed by N timeframes gets strength `+(N − 1) × confluence bonus`, touches are summed, and recency takes the most recent one;
- A timeframe lower than the chart timeframe is unavailable (Pine cannot request lower TFs) — it is skipped automatically and reported in the info table; a timeframe with fewer than 30 bars of data is skipped and reported the same way.
6. **Drawing and output**: horizontal line + right-side label (timeframe · rank · grade · direction), optional zone background band, configurable left/right extension in bars, line width and style; the top-right info table lists timeframe / direction / price / strength / touches / grade / distance %, and its last row shows the data source, candidate count, cluster count, level count, and current price.
7. **Alerts**: when enabled, a close crossing above or below any level triggers `alert()` (`freq_once_per_bar`); the message contains direction, price, and grade.
> Differences from the JS version (caused by Pine, not logic changes): JS draws static levels once at run time, while Pine recomputes on every bar over the same trailing window, so levels roll forward with the market; grouping / timeframe visibility belong to the drawing-object API and have no Pine equivalent; breakout notification is replaced by `alert()`.
## 2. Parameters
### Detection
| Parameter (CLI equivalent) | Default | Range | Description |
|---|---|---|---|
| Lookback bars `--bars` | 250 | 30–1000 | Last N bars taken from each participating timeframe |
| Swing window `--window` | 5 | 2–20 | Bars on each side confirming a swing pivot |
| ATR length `--atr-len` | 14 | 2–100 | SMA period of TR, used by all ATR-based thresholds |
| Cluster zone half-width ATR multiplier `--atr-mult` | 0.50 | 0.01–3 | Defines zone width and clustering tolerance |
| Reaction lookahead `--reaction-bars` | 12 | 2–60 | Window for measuring displacement after a touch |
| Reversal lookahead `--rev-bars` | 24 | 4–120 | Window used by the reversal score |
| Reversal full-score ATR multiplier `--rev-atr` | 6.0 | 0.5–20 | Displacement reaching this ATR multiple scores full marks |
| Recency decay days `--recency-days` | 0 (auto = window span / 3) | 0–365 | Affects the relevance score; 0 means auto |
### Timeframe
| Parameter | Default | Description |
|---|---|---|
| Data source | Current TF | Current TF / Daily / 4H / 1H / 15m / MTF Merge |
| MTF: include current TF | on | Only used when "MTF Merge" is selected |
| MTF: Daily | on | Same as above |
| MTF: 4H | on | Same as above |
| MTF: 1H | off | Same as above |
| MTF: 15m | off | Same as above |
| Cross-TF merge price tolerance % | 0.5 (0.05–5) | Levels from different TFs within this price difference are treated as one |
| Confluence bonus per extra TF | 10 (0–30) | Strength bonus for multi-timeframe confluence |
### Candidates / Rejection
| Parameter (CLI equivalent) | Default | Range | Description |
|---|---|---|---|
| Enable rejection candidates `--rejections` | on | — | When off, only swing pivots are used |
| Same-side wick / range ratio `--rej-wick` | 0.40 | 0.05–0.95 | Upper/lower wick share of the bar range threshold |
| Min wick depth in ATR `--rej-atr` | 0.30 | 0.01–3 | Absolute wick depth threshold |
| Rejection zone half-width ATR `--rej-half` | 0.25 | 0.05–2 | Half-width of the band used to compute the rejection rate |
| Rejection Bayesian prior samples `--rej-prior` | 5 | 0–50 | Small-sample smoothing; 0 disables it |
### Scoring
| Parameter (CLI equivalent) | Default | Range | Description |
|---|---|---|---|
| Touch score curve `--touch-curve` | u | u / mono | Inverted-U (best around 3 touches) or monotonic |
| Inverted-U peak `--touch-peak` | 3 | 1–7 | Only applies to the "u" curve |
| Wick weight in SwingQuality `--wick-weight` | 0.5 | 0–1 | Share of the wick term inside swing quality |
| Wick full-score ratio `--wick-full` | 0.6 | 0.05–1 | Wick ratio reaching this value scores full marks |
| Breakout ATR threshold `--breakout-atr` | 0.50 | 0.01–5 | Displacement threshold for a breakout |
| Retest zone ATR `--retest-atr` | 0.35 | 0.01–5 | Retest tolerance band |
| Strong grade threshold `--strong-score` | 60 | 0–100 | Threshold for "strong" and above; also drives all four grades |
| Min valid touches `--min-touches` | 2 | 1–10 | Clusters below this count are dropped |
| Only strong and above `--only-strong` | off | — | Filters out levels below the strong threshold |
### Selection / Display
| Parameter (CLI equivalent) | Default | Range | Description |
|---|---|---|---|
| Max levels per side `--max` | 6 | 1–20 | Cap for the resistance side and the support side separately |
| Min distance from price % `--near` | 0.15 | 0–5 | Drops levels **closer** to the current price than this (same as the JS version; removes hugging noise) |
| Near-neighbor dedup % `--merge-near` | 0.10 | 0–5 | Levels within this price difference are deduped by relevance |
| Distance weight in display score `--dist-weight` | 0.4 | 0–1 | Higher values favor levels near the current price |
| Ranking order `--rank-by` | dist | dist / rel / str / off | Display score / relevance / strength / no numbering; selection always uses the display score |
| Side by swing type `--side-by-swing` | off | — | When on, swing highs count as resistance and lows as support |
| Draw zone background band | off | — | Draws a translucent band of half-width ATR × multiplier |
| Left extension bars | 60 | 0–500 | Left endpoint of the line relative to the current bar |
| Right extension bars | 50 | 0–500 | Right endpoint of the line relative to the current bar |
| Line width | 1 | 1–4 | — |
| Line style | dashed | solid / dotted / dashed | — |
| Use a single color `--color` | off | — | When on, all levels use the unified color and grade colors are ignored |
| Unified color | `#FF3B30` | — | — |
| Extreme / strong color | `#FF3B30` | — | — |
| Medium color | `#4CAF50` | — | — |
| Weak color | `#FF9500` | — | — |
| Show level info table | on | — | 7-column table at the top right |
### Alerts
| Parameter | Default | Description |
|---|---|---|
| Alert on level breakout | off | Fires when the close crosses a level up or down, at most once per bar; the message includes timeframe, direction, price, and grade |
## 3. Tips and Caveats
- **Timeframe choice**: on a daily chart, use "Current TF + Daily" or "MTF Merge (current + daily + 4H)"; on low timeframe charts (e.g. 15m) only 1H / 4H / D are available, while on a daily chart 4H / 1H / 15m are skipped automatically and marked "unavailable" in the info table.
- **History length**: each timeframe needs at least 30 bars to participate; if the chart history is too short, that timeframe is skipped and reported as "only N bars".
- **Performance**: computation and drawing run only on the last bar (`barstate.islast`); cost grows with lookback length and the number of timeframes — keep `Lookback bars ≤ 300` and 2–3 MTF slots.
- **Tuning**: too many lines → raise `Min valid touches` / `Strong grade threshold` or lower `Max levels per side`; lines too far away → raise `Distance weight in display score`; too much hugging noise → raise `Min distance from price %`.
**Indicator name**: 多周期支撑压力线 SR (Multi-Timeframe S/R Lines)
**Version**: Pine Script v6 · overlay indicator · `max_bars_back=500`, limits: 120 lines / 120 labels / 60 boxes
**File**: `scripts/draw_kline_srlines.pine`
**Origin**: ported line-by-line from `scripts/draw_kline_srlines.mjs` (V7 Auto S/R Lines); the algorithm is aligned with the JS version
## 1. Features
Automatically detects and plots support / resistance levels on the main chart, with strength scoring, grade-based coloring, a level info table, and breakout alerts. Core capabilities:
1. **Candidate detection**
- Swing highs / lows: pivots confirmed by `Swing Window` bars on each side;
- Recent supplement: the last 30 bars are scanned again with window = 2; candidates with `quality < 0.35` are discarded;
- Rejection candidates: non-pivot bars whose same-side wick ratio (wick / bar range) and wick depth (in ATR multiples) both meet the thresholds.
2. **Side split**: by default levels are split by price relative to the latest close (above = resistance, below = support); optionally split by swing type.
3. **Clustering**: greedy merging in ascending price order, tolerance = `max(global floor, point ATR × multiplier, cluster ATR × multiplier)`; cluster center and cluster ATR are the median of members; clusters with fewer members than `Min Touches` are dropped.
4. **Scoring and grading**
- Strength = touches 25% + rejection 20% + reaction 15% + reversal 15% + volume 5% + breakout-retest 10% + swing quality 10%;
- Display score = `(1 - distance weight) × strength + distance weight × distance score` (the closer, the higher); level selection always uses the display score;
- Grades: 极强 (extreme) ≥ strong threshold + 20, 强 (strong) ≥ strong threshold, 一般 (medium) ≥ strong threshold − 20, otherwise 弱 (weak); each grade can be colored separately.
5. **Multi-timeframe (main addition of this release)**
- Data source: Current TF / Daily / 4H / 1H / 15m / **MTF Merge**;
- Higher timeframes always use `request.security(..., lookahead=barmerge.lookahead_off)`: only closed HTF bars are taken, so nothing repaints; each HTF bar is enqueued only once;
- MTF merge: each timeframe runs the full detection once, then results are clustered across timeframes by the cross-TF price tolerance; a price confirmed by N timeframes gets strength `+(N − 1) × confluence bonus`, touches are summed, and recency takes the most recent one;
- A timeframe lower than the chart timeframe is unavailable (Pine cannot request lower TFs) — it is skipped automatically and reported in the info table; a timeframe with fewer than 30 bars of data is skipped and reported the same way.
6. **Drawing and output**: horizontal line + right-side label (timeframe · rank · grade · direction), optional zone background band, configurable left/right extension in bars, line width and style; the top-right info table lists timeframe / direction / price / strength / touches / grade / distance %, and its last row shows the data source, candidate count, cluster count, level count, and current price.
7. **Alerts**: when enabled, a close crossing above or below any level triggers `alert()` (`freq_once_per_bar`); the message contains direction, price, and grade.
> Differences from the JS version (caused by Pine, not logic changes): JS draws static levels once at run time, while Pine recomputes on every bar over the same trailing window, so levels roll forward with the market; grouping / timeframe visibility belong to the drawing-object API and have no Pine equivalent; breakout notification is replaced by `alert()`.
## 2. Parameters
### Detection
| Parameter (CLI equivalent) | Default | Range | Description |
|---|---|---|---|
| Lookback bars `--bars` | 250 | 30–1000 | Last N bars taken from each participating timeframe |
| Swing window `--window` | 5 | 2–20 | Bars on each side confirming a swing pivot |
| ATR length `--atr-len` | 14 | 2–100 | SMA period of TR, used by all ATR-based thresholds |
| Cluster zone half-width ATR multiplier `--atr-mult` | 0.50 | 0.01–3 | Defines zone width and clustering tolerance |
| Reaction lookahead `--reaction-bars` | 12 | 2–60 | Window for measuring displacement after a touch |
| Reversal lookahead `--rev-bars` | 24 | 4–120 | Window used by the reversal score |
| Reversal full-score ATR multiplier `--rev-atr` | 6.0 | 0.5–20 | Displacement reaching this ATR multiple scores full marks |
| Recency decay days `--recency-days` | 0 (auto = window span / 3) | 0–365 | Affects the relevance score; 0 means auto |
### Timeframe
| Parameter | Default | Description |
|---|---|---|
| Data source | Current TF | Current TF / Daily / 4H / 1H / 15m / MTF Merge |
| MTF: include current TF | on | Only used when "MTF Merge" is selected |
| MTF: Daily | on | Same as above |
| MTF: 4H | on | Same as above |
| MTF: 1H | off | Same as above |
| MTF: 15m | off | Same as above |
| Cross-TF merge price tolerance % | 0.5 (0.05–5) | Levels from different TFs within this price difference are treated as one |
| Confluence bonus per extra TF | 10 (0–30) | Strength bonus for multi-timeframe confluence |
### Candidates / Rejection
| Parameter (CLI equivalent) | Default | Range | Description |
|---|---|---|---|
| Enable rejection candidates `--rejections` | on | — | When off, only swing pivots are used |
| Same-side wick / range ratio `--rej-wick` | 0.40 | 0.05–0.95 | Upper/lower wick share of the bar range threshold |
| Min wick depth in ATR `--rej-atr` | 0.30 | 0.01–3 | Absolute wick depth threshold |
| Rejection zone half-width ATR `--rej-half` | 0.25 | 0.05–2 | Half-width of the band used to compute the rejection rate |
| Rejection Bayesian prior samples `--rej-prior` | 5 | 0–50 | Small-sample smoothing; 0 disables it |
### Scoring
| Parameter (CLI equivalent) | Default | Range | Description |
|---|---|---|---|
| Touch score curve `--touch-curve` | u | u / mono | Inverted-U (best around 3 touches) or monotonic |
| Inverted-U peak `--touch-peak` | 3 | 1–7 | Only applies to the "u" curve |
| Wick weight in SwingQuality `--wick-weight` | 0.5 | 0–1 | Share of the wick term inside swing quality |
| Wick full-score ratio `--wick-full` | 0.6 | 0.05–1 | Wick ratio reaching this value scores full marks |
| Breakout ATR threshold `--breakout-atr` | 0.50 | 0.01–5 | Displacement threshold for a breakout |
| Retest zone ATR `--retest-atr` | 0.35 | 0.01–5 | Retest tolerance band |
| Strong grade threshold `--strong-score` | 60 | 0–100 | Threshold for "strong" and above; also drives all four grades |
| Min valid touches `--min-touches` | 2 | 1–10 | Clusters below this count are dropped |
| Only strong and above `--only-strong` | off | — | Filters out levels below the strong threshold |
### Selection / Display
| Parameter (CLI equivalent) | Default | Range | Description |
|---|---|---|---|
| Max levels per side `--max` | 6 | 1–20 | Cap for the resistance side and the support side separately |
| Min distance from price % `--near` | 0.15 | 0–5 | Drops levels **closer** to the current price than this (same as the JS version; removes hugging noise) |
| Near-neighbor dedup % `--merge-near` | 0.10 | 0–5 | Levels within this price difference are deduped by relevance |
| Distance weight in display score `--dist-weight` | 0.4 | 0–1 | Higher values favor levels near the current price |
| Ranking order `--rank-by` | dist | dist / rel / str / off | Display score / relevance / strength / no numbering; selection always uses the display score |
| Side by swing type `--side-by-swing` | off | — | When on, swing highs count as resistance and lows as support |
| Draw zone background band | off | — | Draws a translucent band of half-width ATR × multiplier |
| Left extension bars | 60 | 0–500 | Left endpoint of the line relative to the current bar |
| Right extension bars | 50 | 0–500 | Right endpoint of the line relative to the current bar |
| Line width | 1 | 1–4 | — |
| Line style | dashed | solid / dotted / dashed | — |
| Use a single color `--color` | off | — | When on, all levels use the unified color and grade colors are ignored |
| Unified color | `#FF3B30` | — | — |
| Extreme / strong color | `#FF3B30` | — | — |
| Medium color | `#4CAF50` | — | — |
| Weak color | `#FF9500` | — | — |
| Show level info table | on | — | 7-column table at the top right |
### Alerts
| Parameter | Default | Description |
|---|---|---|
| Alert on level breakout | off | Fires when the close crosses a level up or down, at most once per bar; the message includes timeframe, direction, price, and grade |
## 3. Tips and Caveats
- **Timeframe choice**: on a daily chart, use "Current TF + Daily" or "MTF Merge (current + daily + 4H)"; on low timeframe charts (e.g. 15m) only 1H / 4H / D are available, while on a daily chart 4H / 1H / 15m are skipped automatically and marked "unavailable" in the info table.
- **History length**: each timeframe needs at least 30 bars to participate; if the chart history is too short, that timeframe is skipped and reported as "only N bars".
- **Performance**: computation and drawing run only on the last bar (`barstate.islast`); cost grows with lookback length and the number of timeframes — keep `Lookback bars ≤ 300` and 2–3 MTF slots.
- **Tuning**: too many lines → raise `Min valid touches` / `Strong grade threshold` or lower `Max levels per side`; lines too far away → raise `Distance weight in display score`; too much hugging noise → raise `Min distance from price %`.

Отказ от ответственности
Информация и публикации не предназначены для предоставления и не являются финансовыми, инвестиционными, торговыми или другими видами советов или рекомендаций, предоставленных или одобренных TradingView. Подробнее читайте в Условиях использования.
Отказ от ответственности
Информация и публикации не предназначены для предоставления и не являются финансовыми, инвестиционными, торговыми или другими видами советов или рекомендаций, предоставленных или одобренных TradingView. Подробнее читайте в Условиях использования.