OPEN-SOURCE SCRIPT
Smart Market Structure & Liquidity Engine [SMC]
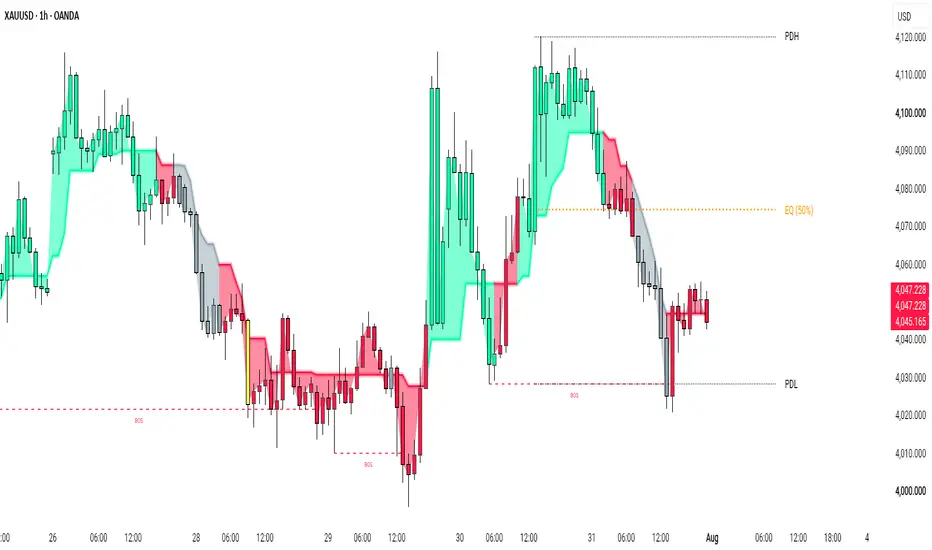
Smart Market Structure and Liquidity Engine [SMC]
Overview and Core Philosophy
The Smart Market Structure and Liquidity Engine is a comprehensive, non-repainting technical analysis framework engineered for price action traders, ICT or SMC enthusiasts, and market structure analysts.
Instead of relying on lagging indicators or noisy indicators, this script combines Adaptive Volatility Filtering (ADX and DMI), Market Structure Shifts (BOS and CHoCH), and Previous Day Equilibrium Logic to give traders a crystal-clear view of market context, institutional bias, and premium versus discount pricing.
Key Features and Technical Mechanics
1. Adaptive Trend Wave and Dynamic Consolidation Engine
Uptrend Expansion (Neon Green): Indicates strong bullish directional bias and institutional buying pressure.
Downtrend Expansion (Hot Red): Indicates strong bearish directional bias and institutional selling pressure.
Smart Consolidation Filter (Slate Grey): Automatically detects sideways and low-momentum markets using native ADX logic. It shifts candles to neutral grey during choppy phases to prevent over-trading.
2. Structural Setup Trigger (Yellow Highlight Candle)
Replaces standard Buy and Sell verbal labels with clean visual highlights to comply with clean chart presentation standards.
Yellow Candle: Marks high-probability rejection candles that align with the active trend wave, highlighting immediate points of interest.
3. Dynamic Daily Levels and Equilibrium (PDH, EQ, PDL)
Previous Day High (PDH): Automatically draws upper daily liquidity levels.
Previous Day Low (PDL): Automatically draws lower daily liquidity levels.
50 Percent Equilibrium Line (EQ): Dynamically plots the 50 percent midpoint of the previous day range, helping traders easily distinguish between Premium (Overpriced) and Discount (Underpriced) zones.
4. Extended High-Probability Zones (Order Blocks)
Automatically plots order block zones upon key setup triggers.
Includes a Live Price Extension Feature, which extends the active zone forward so you can easily observe price reacting inside the box in real-time.
5. Non-Repainting Market Structure (BOS and CHoCH)
BOS (Break of Structure): Signals trend continuation.
CHoCH (Change of Character): Signals early structural reversal.
Built using safe, shift-corrected multi-timeframe security logic to ensure historical accuracy without repainting.
Full Settings and Customization Guide
Neon Wave Glow and Candle Settings
Wave Sensitivity Length: Adjusts how quickly the trend wave reacts to price changes (Default: 8).
Wave Range Multiplier: Controls the volatility band width (Default: 1.6).
Consolidation ADX Threshold: Set the ADX sensitivity cutoff (Lower values require tighter consolidation before turning grey).
Uptrend, Downtrend, Consolidation Colors: Fully customizable palette for chart visualization.
High-Probability Entry Signal (Yellow Candle)
Entry Trigger Sensitivity: Fine-tunes the structural lookback required for trigger highlights.
Entry Signal Color: Customize the setup highlight color.
Previous Day Levels and Equilibrium
Show Active PDH, EQ, PDL: Toggle visual daily liquidity lines on or off.
Line Styles and Colors: Independent style (Solid, Dashed, Dotted) and color settings for PDH, PDL, and 50 percent EQ lines.
Levels Text Size: Adjustable font sizes (Tiny, Small, Normal, Large) for desktop and mobile displays.
High-Probability Zone Customization
Extend Zone To Current Price: Enable to stretch the current active zone into live price action.
Zone Box Styling: Full control over Background Color, Border Color, Border Thickness, Box Opacity, and Label Text Alignment.
How to Use (Educational Framework)
1. Identify Directional Context: Check the color of the Dynamic Ribbon. (Green = Bullish Bias, Red = Bearish Bias, Grey = Ranging or Exercise Caution).
2. Evaluate Premium versus Discount: Compare current price with the 50 percent EQ Line. Long Setups carry higher probability when price is below EQ (Discount). Short Setups carry higher probability when price is above EQ (Premium).
3. Execution Alignment: Look for structural rejections (Yellow Setup Candle) tapping into active HP Zones near key PDH or PDL levels.
House Rules and Educational Disclaimer
No Repainting: All historical levels, zones, and structure lines are calculated on bar-close logic.
Educational Tool: This script is designed exclusively for market structure mapping and educational analysis. It does not provide financial advice or automated trading signals.
Overview and Core Philosophy
The Smart Market Structure and Liquidity Engine is a comprehensive, non-repainting technical analysis framework engineered for price action traders, ICT or SMC enthusiasts, and market structure analysts.
Instead of relying on lagging indicators or noisy indicators, this script combines Adaptive Volatility Filtering (ADX and DMI), Market Structure Shifts (BOS and CHoCH), and Previous Day Equilibrium Logic to give traders a crystal-clear view of market context, institutional bias, and premium versus discount pricing.
Key Features and Technical Mechanics
1. Adaptive Trend Wave and Dynamic Consolidation Engine
Uptrend Expansion (Neon Green): Indicates strong bullish directional bias and institutional buying pressure.
Downtrend Expansion (Hot Red): Indicates strong bearish directional bias and institutional selling pressure.
Smart Consolidation Filter (Slate Grey): Automatically detects sideways and low-momentum markets using native ADX logic. It shifts candles to neutral grey during choppy phases to prevent over-trading.
2. Structural Setup Trigger (Yellow Highlight Candle)
Replaces standard Buy and Sell verbal labels with clean visual highlights to comply with clean chart presentation standards.
Yellow Candle: Marks high-probability rejection candles that align with the active trend wave, highlighting immediate points of interest.
3. Dynamic Daily Levels and Equilibrium (PDH, EQ, PDL)
Previous Day High (PDH): Automatically draws upper daily liquidity levels.
Previous Day Low (PDL): Automatically draws lower daily liquidity levels.
50 Percent Equilibrium Line (EQ): Dynamically plots the 50 percent midpoint of the previous day range, helping traders easily distinguish between Premium (Overpriced) and Discount (Underpriced) zones.
4. Extended High-Probability Zones (Order Blocks)
Automatically plots order block zones upon key setup triggers.
Includes a Live Price Extension Feature, which extends the active zone forward so you can easily observe price reacting inside the box in real-time.
5. Non-Repainting Market Structure (BOS and CHoCH)
BOS (Break of Structure): Signals trend continuation.
CHoCH (Change of Character): Signals early structural reversal.
Built using safe, shift-corrected multi-timeframe security logic to ensure historical accuracy without repainting.
Full Settings and Customization Guide
Neon Wave Glow and Candle Settings
Wave Sensitivity Length: Adjusts how quickly the trend wave reacts to price changes (Default: 8).
Wave Range Multiplier: Controls the volatility band width (Default: 1.6).
Consolidation ADX Threshold: Set the ADX sensitivity cutoff (Lower values require tighter consolidation before turning grey).
Uptrend, Downtrend, Consolidation Colors: Fully customizable palette for chart visualization.
High-Probability Entry Signal (Yellow Candle)
Entry Trigger Sensitivity: Fine-tunes the structural lookback required for trigger highlights.
Entry Signal Color: Customize the setup highlight color.
Previous Day Levels and Equilibrium
Show Active PDH, EQ, PDL: Toggle visual daily liquidity lines on or off.
Line Styles and Colors: Independent style (Solid, Dashed, Dotted) and color settings for PDH, PDL, and 50 percent EQ lines.
Levels Text Size: Adjustable font sizes (Tiny, Small, Normal, Large) for desktop and mobile displays.
High-Probability Zone Customization
Extend Zone To Current Price: Enable to stretch the current active zone into live price action.
Zone Box Styling: Full control over Background Color, Border Color, Border Thickness, Box Opacity, and Label Text Alignment.
How to Use (Educational Framework)
1. Identify Directional Context: Check the color of the Dynamic Ribbon. (Green = Bullish Bias, Red = Bearish Bias, Grey = Ranging or Exercise Caution).
2. Evaluate Premium versus Discount: Compare current price with the 50 percent EQ Line. Long Setups carry higher probability when price is below EQ (Discount). Short Setups carry higher probability when price is above EQ (Premium).
3. Execution Alignment: Look for structural rejections (Yellow Setup Candle) tapping into active HP Zones near key PDH or PDL levels.
House Rules and Educational Disclaimer
No Repainting: All historical levels, zones, and structure lines are calculated on bar-close logic.
Educational Tool: This script is designed exclusively for market structure mapping and educational analysis. It does not provide financial advice or automated trading signals.
Скрипт с открытым кодом
В истинном духе TradingView, создатель этого скрипта сделал его открытым исходным кодом, чтобы трейдеры могли проверить и убедиться в его функциональности. Браво автору! Вы можете использовать его бесплатно, но помните, что перепубликация кода подчиняется нашим Правилам поведения.

Отказ от ответственности
Информация и публикации не предназначены для предоставления и не являются финансовыми, инвестиционными, торговыми или другими видами советов или рекомендаций, предоставленных или одобренных TradingView. Подробнее читайте в Условиях использования.
Скрипт с открытым кодом
В истинном духе TradingView, создатель этого скрипта сделал его открытым исходным кодом, чтобы трейдеры могли проверить и убедиться в его функциональности. Браво автору! Вы можете использовать его бесплатно, но помните, что перепубликация кода подчиняется нашим Правилам поведения.
Отказ от ответственности
Информация и публикации не предназначены для предоставления и не являются финансовыми, инвестиционными, торговыми или другими видами советов или рекомендаций, предоставленных или одобренных TradingView. Подробнее читайте в Условиях использования.