Dynamic Fibonacci Channels
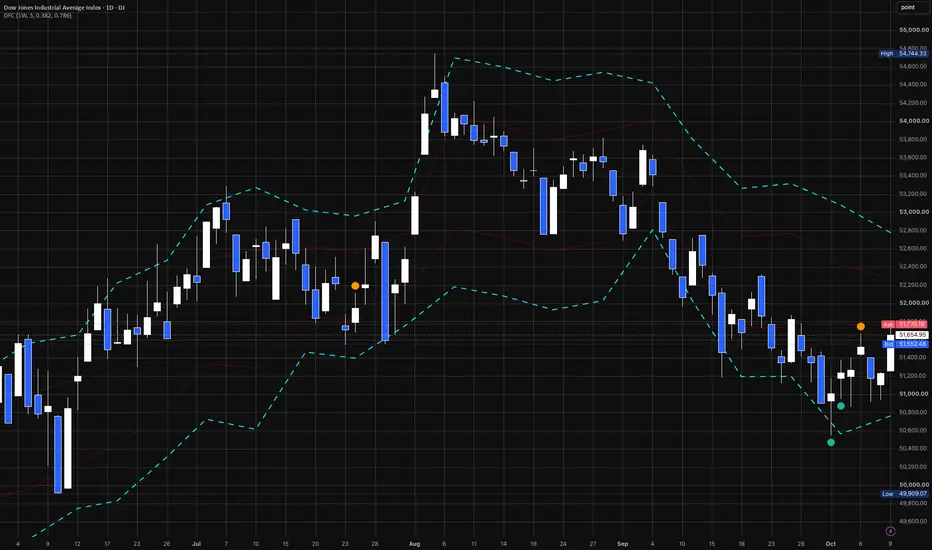
Robert Krausz's Dynamic Fibonacci Channels, as described in his Fibonacci Trader software, for TradingView. A center line, the Dynamic Balance Point, with two Fibonacci channels around it, built from a rolling window of the last N bars of a timeframe you choose.
HOW IT WORKS
• Dynamic Balance Point (DBP) = (highest high + lowest low + close) / 3 over the last N bars of the selected timeframe. The current bar is included, so the value updates live.
• Range = highest high − lowest low of the same N bars.
• Each channel is centered on the DBP and its full width is Range × ratio:
Upper = DBP + Range × ratio / 2
Lower = DBP − Range × ratio / 2
• Defaults: Channel 1 = 0.382, Channel 2 = 0.786.
HOW TO USE IT
The DBP is the market's balance over the last N bars. The channels mark how far price is stretched from that balance:
• Inside Channel 1: price is near balance.
• Beyond Channel 2: price is far from balance; watch for exhaustion or a strong trend.
Use the channels as reference levels for entries, stops and targets, together with your own trend tools. On its own it is not a signal generator.
INPUTS
• Timeframe (default D): the timeframe the calculation runs on.
• Length (default 5): number of bars in the window.
• Channel 1 / Channel 2: on/off and ratio for each channel.
Colors, widths and styles are set in the Style tab. The DBP line is hidden by default; enable it in the Style tab.
DRAWING AND LIMITATIONS
• On a chart at the selected timeframe, each bar shows the value calculated at that bar's close. The current bar updates until it closes.
• On a lower chart timeframe (for example, a daily DFC on an hourly chart), each period gets one point on its last chart bar, and the points are joined by a line. The line between two points is drawn for readability only: the bars in between did not know that period's final value yet. On the last bar the line continues to the current period's live value, which changes until the period closes.
• Nothing is drawn on a chart above the selected timeframe.
• No forward shift.
CREDITS
The concept and the default ratios are Robert Krausz's (Fibonacci Trader). The code is my own open-source implementation.
HOW IT WORKS
• Dynamic Balance Point (DBP) = (highest high + lowest low + close) / 3 over the last N bars of the selected timeframe. The current bar is included, so the value updates live.
• Range = highest high − lowest low of the same N bars.
• Each channel is centered on the DBP and its full width is Range × ratio:
Upper = DBP + Range × ratio / 2
Lower = DBP − Range × ratio / 2
• Defaults: Channel 1 = 0.382, Channel 2 = 0.786.
HOW TO USE IT
The DBP is the market's balance over the last N bars. The channels mark how far price is stretched from that balance:
• Inside Channel 1: price is near balance.
• Beyond Channel 2: price is far from balance; watch for exhaustion or a strong trend.
Use the channels as reference levels for entries, stops and targets, together with your own trend tools. On its own it is not a signal generator.
INPUTS
• Timeframe (default D): the timeframe the calculation runs on.
• Length (default 5): number of bars in the window.
• Channel 1 / Channel 2: on/off and ratio for each channel.
Colors, widths and styles are set in the Style tab. The DBP line is hidden by default; enable it in the Style tab.
DRAWING AND LIMITATIONS
• On a chart at the selected timeframe, each bar shows the value calculated at that bar's close. The current bar updates until it closes.
• On a lower chart timeframe (for example, a daily DFC on an hourly chart), each period gets one point on its last chart bar, and the points are joined by a line. The line between two points is drawn for readability only: the bars in between did not know that period's final value yet. On the last bar the line continues to the current period's live value, which changes until the period closes.
• Nothing is drawn on a chart above the selected timeframe.
• No forward shift.
CREDITS
The concept and the default ratios are Robert Krausz's (Fibonacci Trader). The code is my own open-source implementation.

Отказ от ответственности
Информация и публикации не предназначены для предоставления и не являются финансовыми, инвестиционными, торговыми или другими видами советов или рекомендаций, предоставленных или одобренных TradingView. Подробнее читайте в Условиях использования.
Отказ от ответственности
Информация и публикации не предназначены для предоставления и не являются финансовыми, инвестиционными, торговыми или другими видами советов или рекомендаций, предоставленных или одобренных TradingView. Подробнее читайте в Условиях использования.